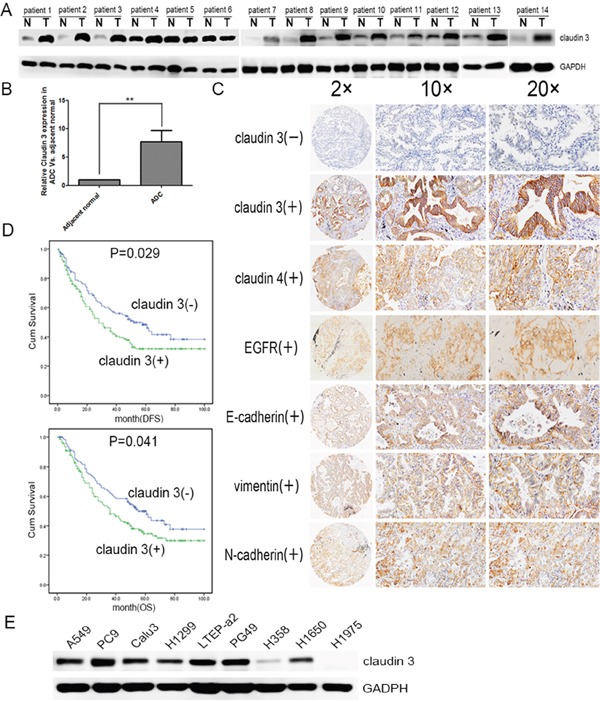
Figure 1. CLDN3 expression in lung cancer patients and cell lines.

A. CLDN3 expression in lung cancer and adjacent normal lung samples. Total tissue lysates were prepared using frozen matched normal and cancer lung tissues from the same patient. GAPDH was used as a loading control. (N, adjacent normal tissue;T, tumor tissue) B. CLDN3 was significantly increased in the adenocarcinoma group compared with the normal specimens (**p<0.01). C. Normalized expression values for CLDN3 in normal adjacent lung specimens (n=40) compared with adenocarcinoma samples (n=261) from the Tianjin Medical University Cancer Hospital and Institute using microarray analysis. The demographics for this group are listed in Table 1. Representative images of protein expression in an ADC determined by immunohistochemistry (IHC) with anti-CLDN3, anti-CLDN4, anti-EGFR and EMT index antibody (brown). The slide was counterstained with hematoxylin. Original magnification, ×20(left); ×100 (middle); ×200 (right). D. Kaplan–Meier curves for the disease free survival and overall survival rates of patients with ADC according to the expression level of CLDN3. Blue, patients with lower CLDN3 expression (n=117); green, patients with higher expression of CLDN3 (n=144, median DFS was 52-month vs. 28-month and median OS 55-month vs. 36-month, respectively; pDFS=0.029, pOS =0.041). E. CLDN3 expression was detected in lung adenocarcinoma cell lines: LTEP-a 2, PC9, and PG49 cells express CLDN3 very highly; NCI-H1650, NCI-H1299, A549, and CaLu-3 cells express moderate levels of CLDN3; and H1975 and H358 cells almost do not express CLDN3 at all.
