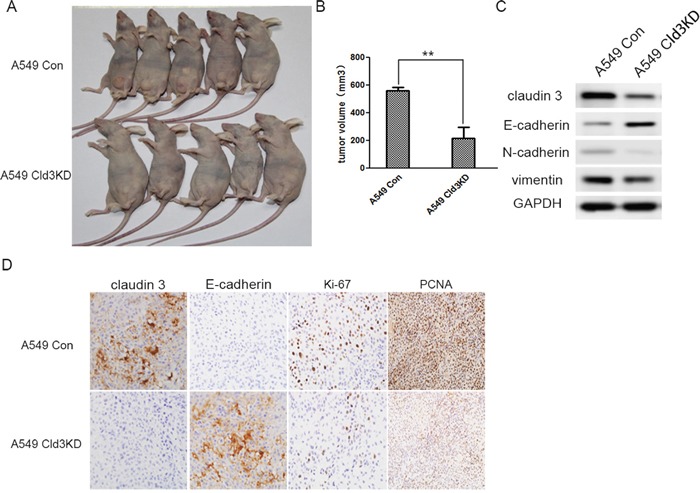
Figure 7. In vivo tumor promoting role of CLDN3 in ADC.

A. Representative examples of tumors formed in nude mice following the injection of Cld3KD expressing A549 cells (lower panel) and A549 Con cells (upper panel). B. The volume of A549Cld3KD group is much smaller than control group(**p<0.01, t-test) C. The knockdown of CLDN3 in A549 cells induced E- cadherin upregulation, but decreased vimentin and N-cadherin expression D. Compared with the control group, the Cld3KD group demonstrated upregulation of E-cadherin and a lower proliferation rate (Ki-67 and PCNA index).
