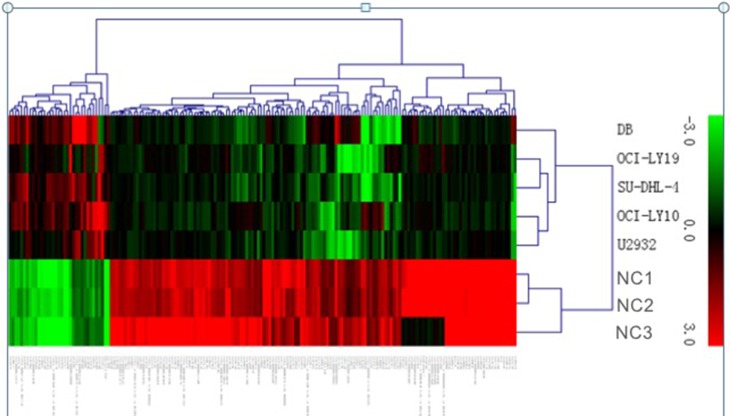
Figure 1. Heat map showing differentially expressed lncRNAs from DLBCL cells compared with three normal B cells.
Each row represents one cell sample, and each column represents one lncRNA. The relative lncRNA expression is depicted according to the color scale. Red indicates up-regulation; green indicates down- regulation. 3.0, 0, and 3.0 are fold changes in the corresponding spectrum.

