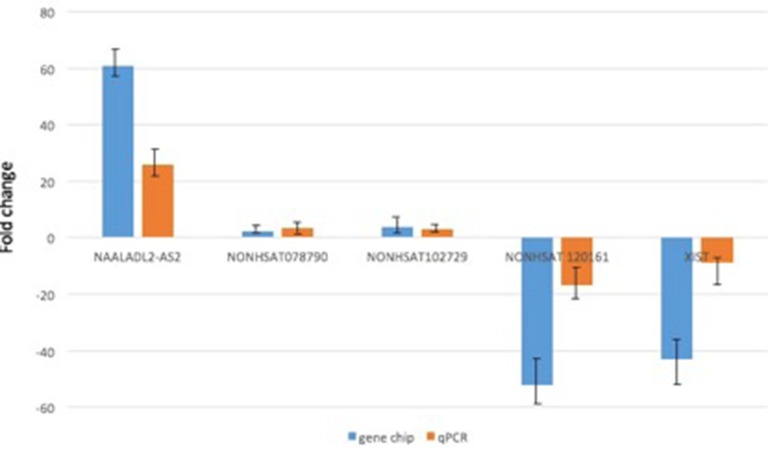
Figure 3. qRT-PCR validation of 5 differentially expressed lncRNAs in 20 DLBCL tumor samples.
The result showed that expressions of lncRNAs were consistent with the microarray data in lymphoma tissues relative to the normal B cell samples. The heights of the columns in the chart represent the mean fold changes in expression for each of these lncRNAs. Bars represent SEM. Fold change is positive when the expression is upregulated (DLBCL cell/normal B cell) and negative when down-regulated.

