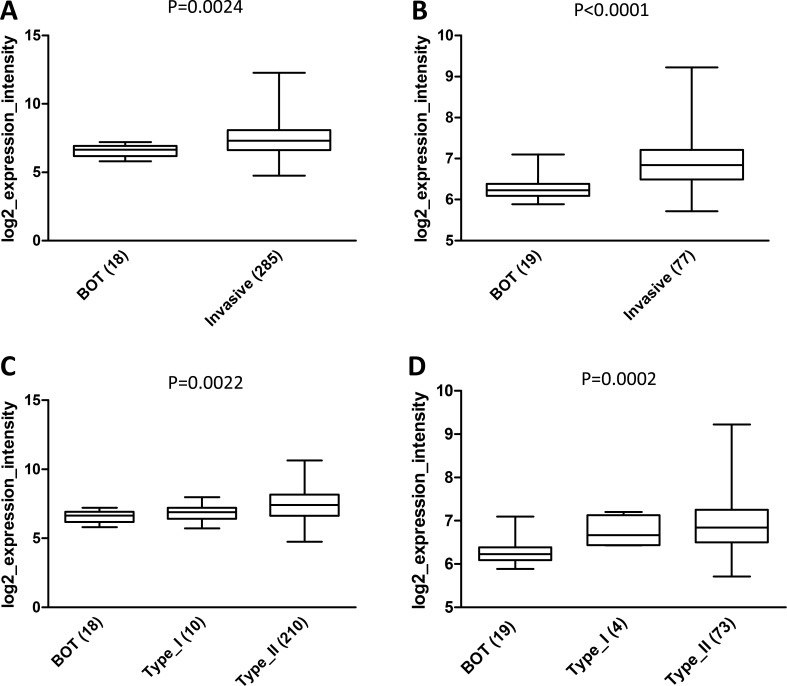
Figure 9. In silico analysis of AF1q expression in the Tothill and Berchuck datasets.
(A) and (B) Boxplots showing AF1q mRNA expression in BOT compared to invasive tumors in Tothill (p = 0.0024 ) and Berchuck (p < 0.0001) datasets, respectively. (C) and (D) Boxplots showing AF1q mRNA expression in BOT and invasive tumors taking into account the pathological dualistic classification of type I and type II in Tothill (p = 0.0022) and Berchuck (p = 0.0002) datasets, respectively. Numbers in brackets indicate the number of analyzed cases in each group.

