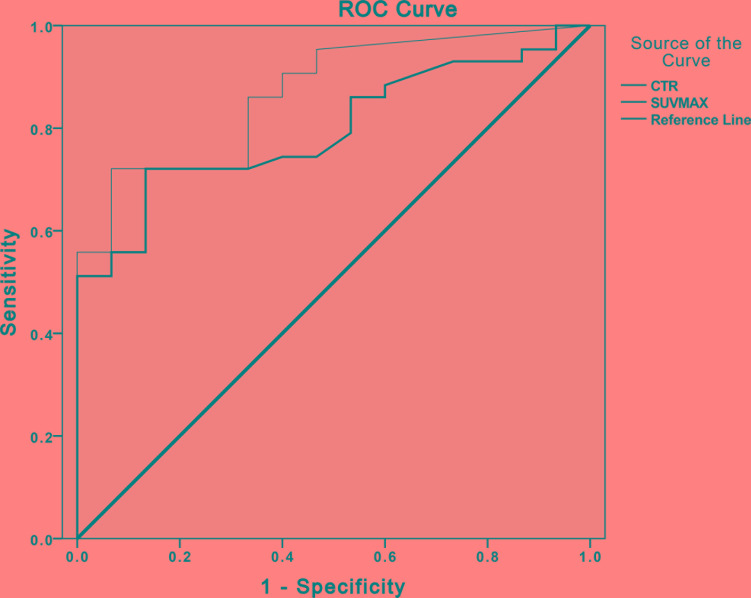
Figure 4. The receiver operating characteristic (ROC) curve analyses to compare the capability of SUVmax and CTR.
Graph illustrates results of ROC analyses of CTR > 0.39 (thin line) at HRCT and SUVmax > 0.95 (thick line) at PET/CT as reference for discriminating IAC from AIS-MIA in solitary pulmonary GGNs. Areas under ROC curve for CTR > 0.39 (0.868, p < 0.05) was slightly greater than that for SUVmax > 0.95 (0.798, p < 0.05). AIS: adenocarcinoma in situ; CTR: consolidation/tumor ratio; IAC: invasive adenocarcinoma; MIA: minimally invasive adenocarcinoma; SUVmax: maximum standard uptake value.

