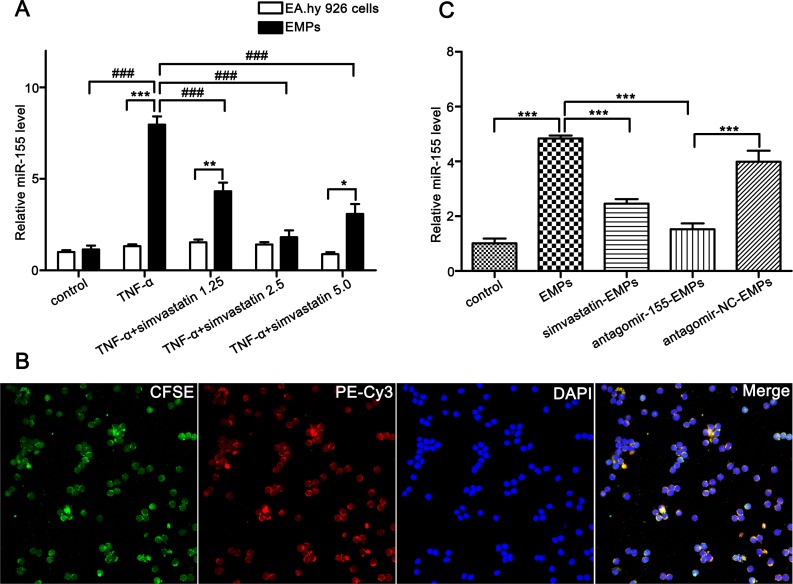
Figure 2. EMPs bind to and merge with T lymphocytes, transfer their miR-155 to T lymphocytes.
(A) miR-155 levels in EMPs (from EA.hy926, TNF-α-stimulated EA.hy926, TNF-α-stimulated EA.hy926 protected by simvastatin of 1.25 μmol/L, 2.5 μmol/L and 5 μmol/L) and maternal cells. *P < 0.05, miR-155 levels in EMPs from TNF-α-stimulated EA.hy926 protected by 5 μmol/L simvastatin and maternal cells. *P < 0.01, miR-155 levels in EMPs from TNF-α-stimulated EA.hy926 protected by 1.25 μmol/L simvastatin and maternal cells. ***P < 0.001, miR-155 levels in EMPs from TNF-α-stimulated EA.hy926 and maternal cells. ###P < 0.001, Levels of miR-155 in different EMPs were compared. Average values ± SD from three independent experiments were plotted. (B) Representative confocal microscopy images of the fusion of T lymphocytes with EMPs (original magnification ×600). T lymphocytes were cultured with CFSE-labeled EMPs from EA.hy926 transfected with miR-155 mimic stained with PE-Cy3 (double fluorescently-labeled EMPs). The PE-Cy3-miR-155 signals were detected in the cytoplasm of T lymphocytes (red), and green signals indicate CFSE-labeled EMPs. PE-Cy3-miR-155 signals are colocalized with CFSE in T lymphocytes (yellow). Nuclear counterstaining was performed using DAPI (blue). (C) miR-155 levels in T lymphocytes were determined after incubated with 10 μg/mL EMPs for 3 days. ***P < 0.001. Average values ± SD from three independent experiments were plotted.

