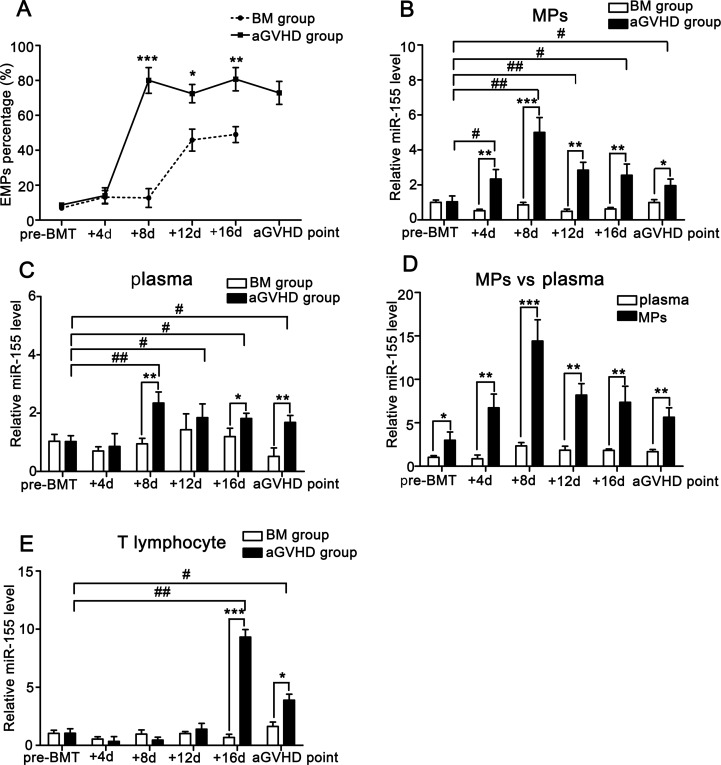
Figure 4. miR-155 expressions in MPs, plasma and T lymphocytes of peripheral blood from BM and aGVHD mice before allo-BMT, at +4d, +8d, +12d, +16d and aGVHD point.
Average values ± SD from three independent experiments were plotted. (A) EMPs isolated from the peripheral blood of BM and aGVHD groups were assessed by flow cytometry analysis. *P < 0.05, *P < 0.01, ***P < 0.001. (B) miR-155 levels in MPs isolated from the peripheral blood of BM and aGVHD mice were compared. *P < 0.05, *P < 0.01, ***P < 0.001. Expressions of miR-155 on +4d, +8d, +12d, +16d and aGVHD point were compared with pre-BMT level. #P < 0.05, ##P < 0.01. (C) Expressions of miR-155 in plasma from BM and aGVHD mice were compared. *P < 0.05, *P < 0.01. miR-155 levels in plasma at +4d, +8d, +12d, +16d and aGVHD point were compared with pre-BMT level. #P < 0.05, ##P < 0.01. (D) miR-155 levels in MPs and plasma at indicated time points were compared in aGVHD mice. *P < 0.05, *P < 0.01, ***P < 0.001. (E) miR-155 in T lymphocytes from peripheral blood of BM and aGVHD mice was compared. *P < 0.05, ***P < 0.001. miR-155 in T lymphocytes at +4d, +8d, +12d, +16d and aGVHD point were compared with pre-BMT level. #P < 0.05, ##P < 0.01.

