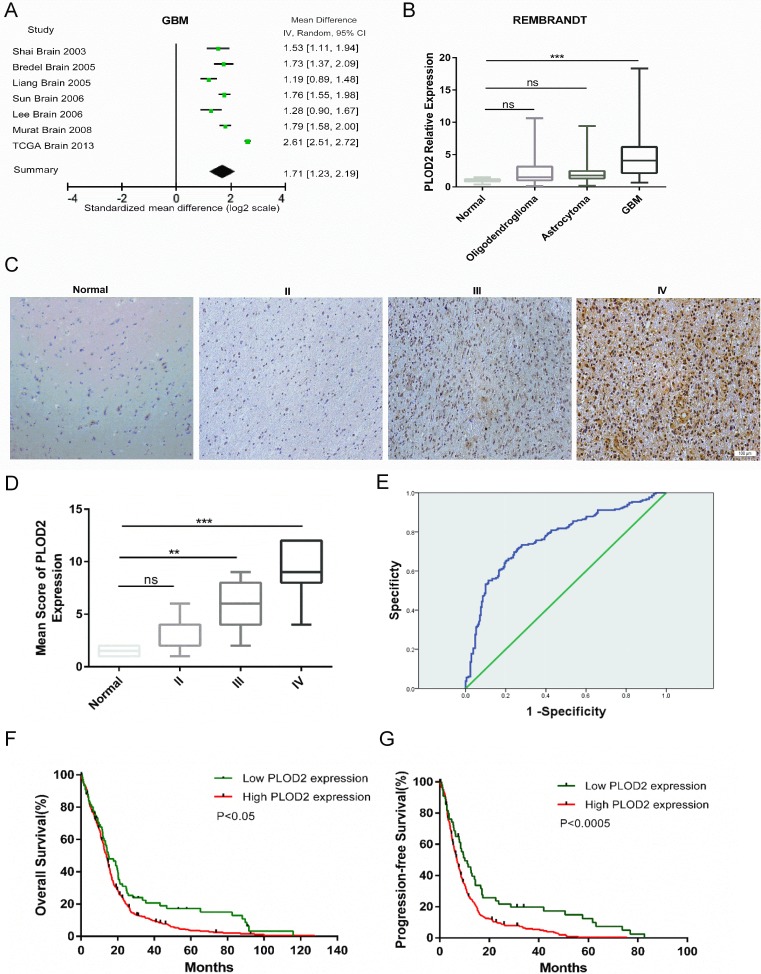
Figure 1. PLOD2 is overexpressed in glioblastoma and correlates with poor prognosis.
(A) Forest plot of PLOD2 expression levels in glioblastoma (n = 861) versus non-neoplastic brain tissue samples from the publicly available Oncomine datasets. The x-axis is the standardized mean difference between glioblastoma and normal PLOD2 expression based on a log2 scale. (B) Expression of PLOD2 mRNA in human gliomas of all grades (n = 178) from cases in the publicly available REMBRANDT database. (C) Representative images of immunohistochemical staining for PLOD2 in sections (4 μm) from primary human tumor samples (Scale bars, 100 μm). (D) Comparison of PLOD2 mRNA levels among human gliomas based on tumor grade. Mean ± SD, **P < 0.01; ***P < 0.001; ns, not significant, versus normal samples. (E) ROC curve showing sensitivity of PLOD2 as a marker to distinguish non-glioblastoma and glioblastoma patients. (F and G) Kaplan-Meier analyses for overall survival (OS, n = 522) and progression-free survival (PFS, n = 386) for glioblastoma patients in TCGA cohorts based on PLOD2 expression levels (OS: P < 0.05; PFS: P < 0.0005, by the log-rank test).

