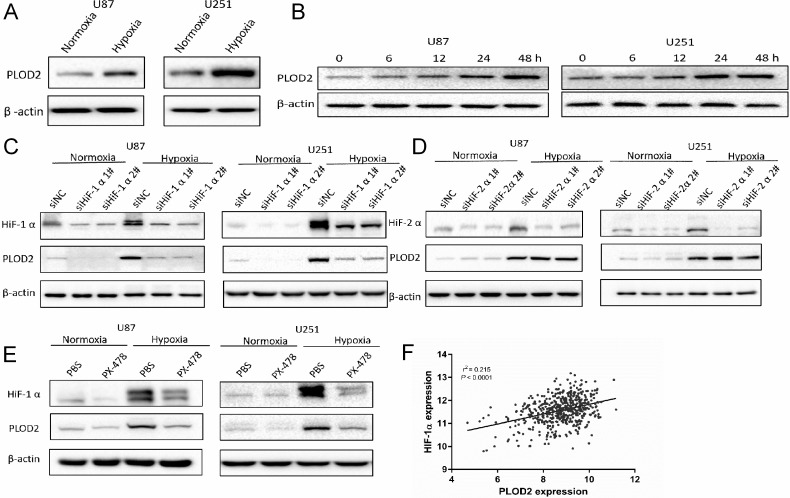
Figure 2. Hypoxia induces PLOD2 expression through HIF-1α in U87 and U251 glioma cells.
(A) Western blot for detection of PLOD2 levels in lysates prepared from U87 and U251 cells cultured under hypoxic conditions for 48 h. (B) Western blot for PLOD2 levels in U87 and U251 cultured 0, 6, 12, 24, 48 h under hypoxic conditions. (C) Western blot for PLOD2 and HIF-1α levels in U87 and U251 cells transfected with negative control siRNA (siNC) and HIF-1α siRNA (siHIF-1α#1-2; 100 nmol/L) and cultured under hypoxic conditions for 48 h. (D) Western blot for PLOD2 and HIF-2α levels in U87 and U251 cells transfected with negative control siRNA (siNC) and HIF-2α siRNA (siHIF-2α#1-2; 100 nmol/L) and cultured under hypoxic conditions for 48 h. (E) Western blot for PLOD2 and HIF-1α levels in U87 and U251 cells pre-treated with PX-478 (10 μM) and cultured under normoxic and hypoxic conditions for 48 h. β-actin was used as a loading control. (F) Correlation between PLOD2 and HIF-1α mRNA levels as determined from the publicly available TCGA data (n = 528).

