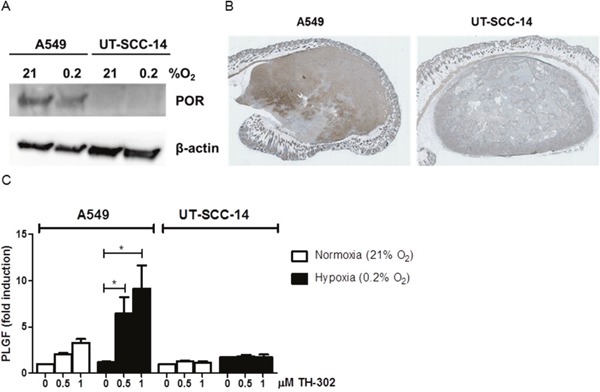
Figure 2. Differential POR- and PLGF-levels in A549 and UT-SCC-14 tumors.

(A) Protein levels of cytochrome P450 oxidoreductase (POR) in A549 and UT-SCC-14 cells incubated under normoxia (21% O2) and hypoxia (0.2% O2, 24 hours) as determined by western blotting. (B) Staining of A549 (left) and UT-SCC-14 (right)-derived tumor xenografts sections with anti–POR antibodies. (C) Levels of secreted PLGF in A549 and UT-SCC-14 conditioned medium in normoxia (21% O2) and hypoxia (0.2% O2, 24 hours) as determined using Bio-plex assay. Data are shown as fold induction over non-treated normoxic samples in three independent experiments, error bars represent SEM.
