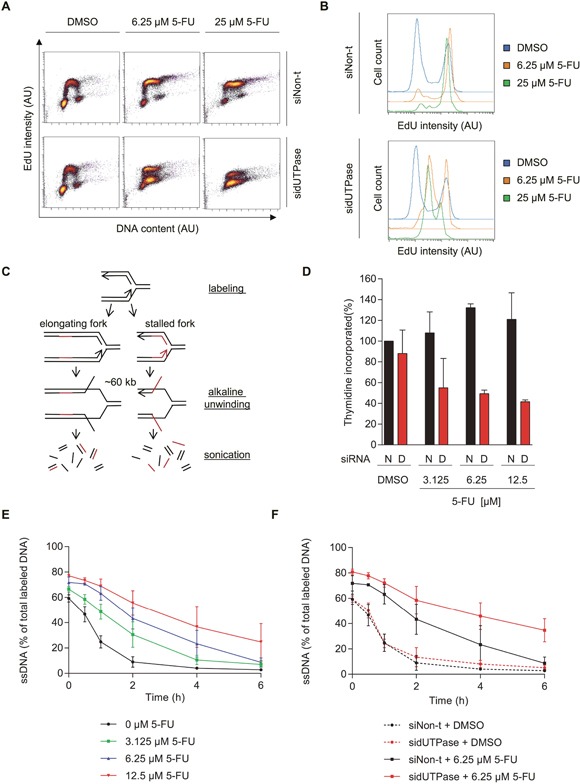
Figure 2. 5-FU treatment accumulates cells in S-phase by decreasing replication fork progression, which can be accentuated by dUTPase depletion.

(A) FACS analysis of incorporated EdU after the indicated treatments. After 72 hours of siRNA transfection, cells were treated for 48 hours with the indicated concentration of 5-FU. Replication was labeled by addition of 1 μM EdU for 30 min, which was analyzed by FACS. EdU intensity is depicted on the y-axis and DNA content (To Pro intensity) on the x-axis. A representative experiment is shown. Abbreviation: AU: arbitrary unit. (B) Representative histograms displaying the EdU intensity over cell count (events) of the experiment shown in Figure 2A. Abbreviation: AU: arbitrary unit. (C) Schematic illustration of the ADU technique. (D) Total amount of 3H-thymidine incorporated within 30 min after 48 hours of 5-FU treatment in dUTPase depleted and control cells. Data shown as average ± SEM from two independent experiments. Data shown as average ± SEM from two independent experiments. (E) Replication fork progression, measured by the ADU technique, of SW620 cells treated with increasing concentrations of 5-FU for 48 hours. (F) Replication fork progression, measured by the ADU technique, in dUTPase depleted and control cells treated for 48 hours with 5-FU. For E-F: Percentage of radioactive label in the single stranded DNA (ssDNA) fraction compared to the total signal (ssDNA plus double stranded DNA) is depicted on the y-axis. Data shown as average ± SEM from two independent experiments.
