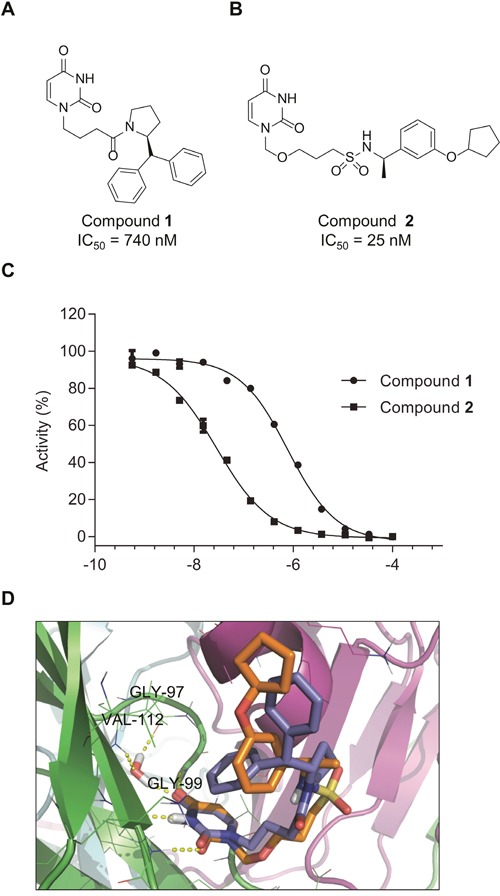
Figure 4. Compounds 1 and 2 inhibit dUTPase activity.

Chemical structures of the dUTPase inhibitors 1 (A) and 2 (B) (C) Potency of compounds 1 and 2 was assessed by malachite green assay, using dUTP as a substrate. Percentage activity was calculated compared to DMSO treated control. Inhibition curves shown are representative curves of two independent inhibition experiments performed using duplicate measurements. IC50 values displayed in (A) and (B) were determined from two independent experiments performed in duplicate and are shown as average ± SD. (D) Superposition of the top-ranked docking poses of compounds 1 (blue sticks) and 2 (orange sticks). The different monomers of the protein are rendered as green, cyan and magenta cartoons. H-bonds are shown as yellow dotted lines.
