
Figure 9.
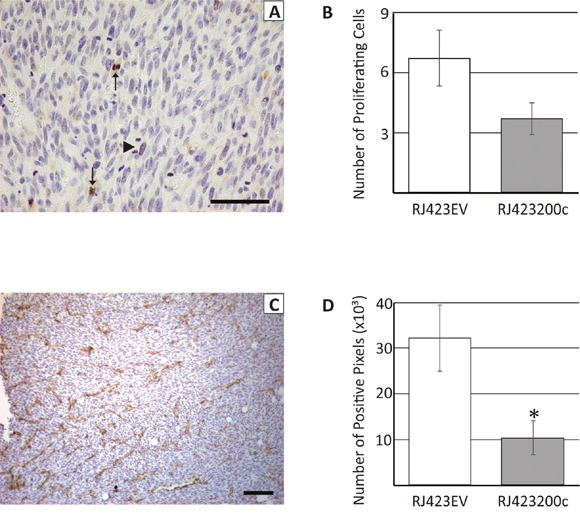
Representative section of a tumor stained with anti-Ki67 (A) or anti-CD31 (C). Arrows in panel (A) indicate positive staining for Ki67 while the arrowhead indicates a mitotic cell that did not stain with the anti-Ki67 antibody. Ki67 and CD31 staining were quantified and this data is shown in panels (B) and (D), respectively. Each bar represents the mean ± SEM of 3 independent trials, *p<0.05. Scale bars, 100μm.