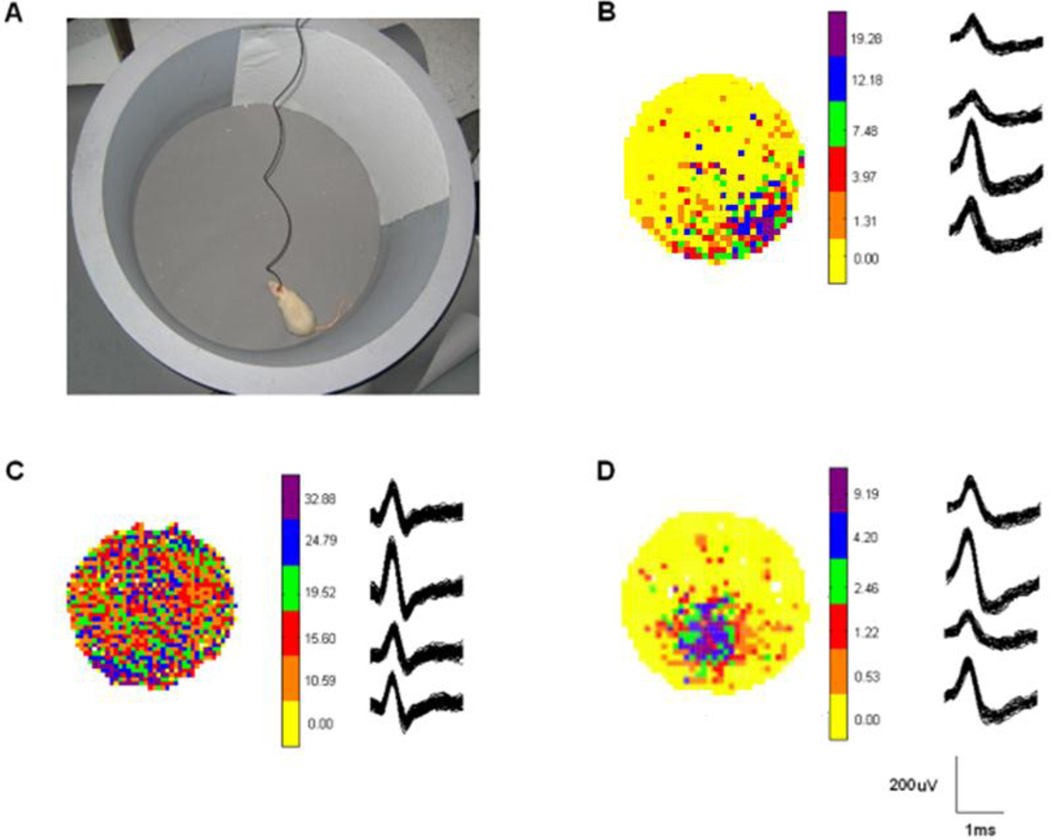
Fig. 2.
Place cell recordings. The recording cylinder with cue card is shown in A. Examples of place cells (B,D) and an interneuron (C) are shown. The place cell in B is at approximately 5 o’clock while the place cell in D is at approximately 7 o’clock but is closer to the center of the cylinder than the cell depicted in B. Firing frequency is color coded. Yellow shows areas of the cylinder in which the cell did not fire while the green, blue and purple colors show high firing rates in the place firing field. Wavefroms from the tetrodes are shown next to the color coded firing rates. The neuron recorded in C is an interneuron which shows a higher firing rate but no clear place preference.

