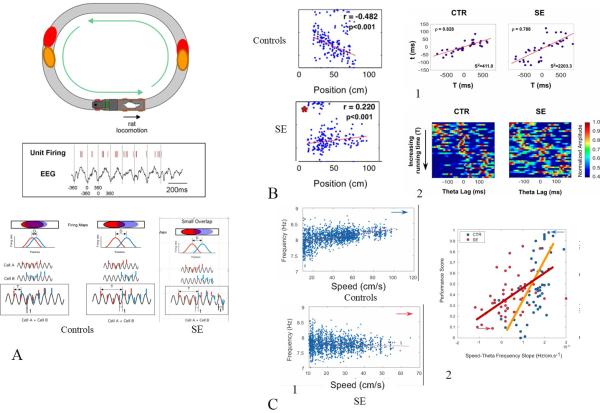
Fig. 3.
Schematic representation of SE induced changes in theta and single cell firing. A. As rat runs around the track several place cells fire. Place cells with partially overlapping place fields (red and blue) will show a different firing relationship on whether the field centers are distant or close to each other. There is a linear relationship between the inter-field distance and the time required to go from the field center to another (running time, T). Because each cell firing is doing phase precession (middle trace), there is also a relationship between the running time (T) and the time interval between APs within the same theta cycle (t). Cells with close fields will fire at short time interval whereas cells with distant fields will fire at long time interval. In the SE rats normal phase precession does not occur and the time interval between APs (t) is variable. As shown in B, the control rat has phase precession whereas the SE rats show phase procession. This abnormality in phase precession is reflected in an abnormal compression of temporal sequences in SE rats. Compared to control pairs of neurons (B1), which show a strong correlation between running-time (T) and theta-time lags (t), SE pairs showed a greater variability as expressed by the total variance about the regression line. Cross correlograms for all control and SE pairs ordered in increasing running time (from -1000 ms to 1000 ms) (B2). Each horizontal line represents the cross-correlogram of an individual pair of place cells with the amplitude represented by a color code. In control pairs, the diagonal band near the zero lag line shifts as running-time lag increases. In contrast, this pattern is much less obvious in SE pairs. C. Rats with SE also have impaired speed-theta frequency correlations. Whereas control rats have an increase in frequency of theta with increasing speed, this is not the case with the SE rats (C1). As shown in the right panel (C2), performance in a spatial memory task is related to the speed-frequency relationship with SE rats with a poor speed-theta frequency showing impaired performance compared to controls. Modified from Lenck-Santini et al. (Lenck-Santini and Holmes, 2008) and Richard et al. (Richard et al., 2013) with permission.

