
FIGURE 1.
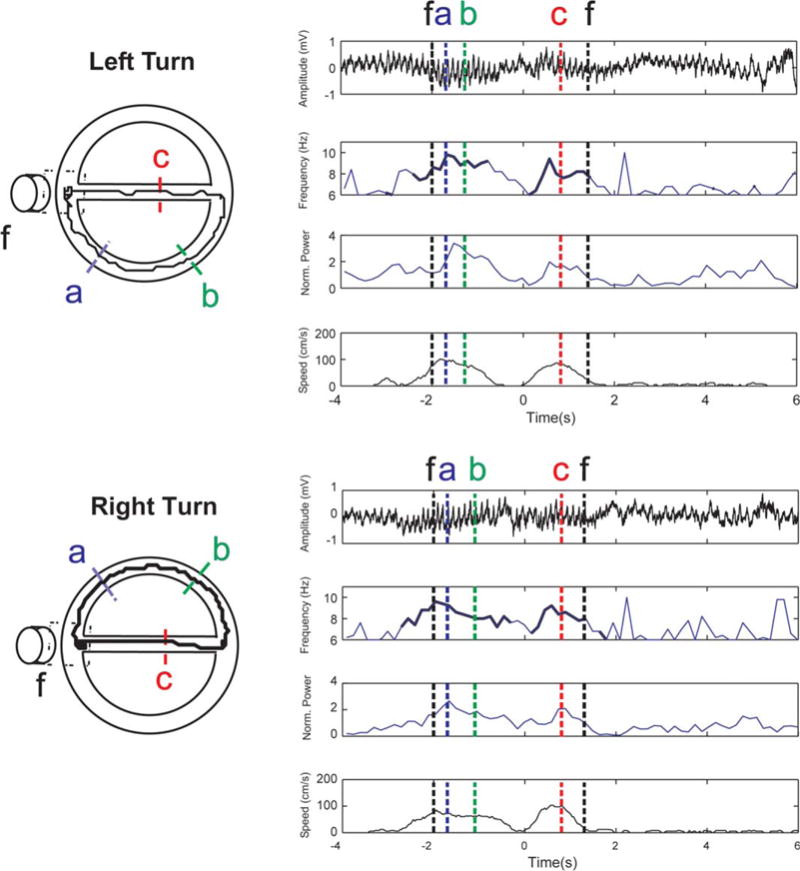
Apparatus, performance and EEG measurements. Examples of two consecutive trials in a session performed by a CTR rat are represented. The apparatus (left) contains and is surrounded by visual cues. Rats were trained to alternate continuously between left (top) and right (bottom) turns. For each trial, unfiltered hippocampal LFP (first plot from the top), instantaneous theta frequency power and instantaneous speed are represented. Theta characteristics where only performed during periods with speeds > 10cm/s (thicker lines in the frequency plots). Times at which the rat croses locations a,b,c and the feeder (f) are represented as color doted lines. Note the simultaneous increase in theta amplitude and frequency with increasing speed. [Color figure can be viewed in the online issue, which is available at wileyonlinelibrary.com.]