
FIGURE 4.
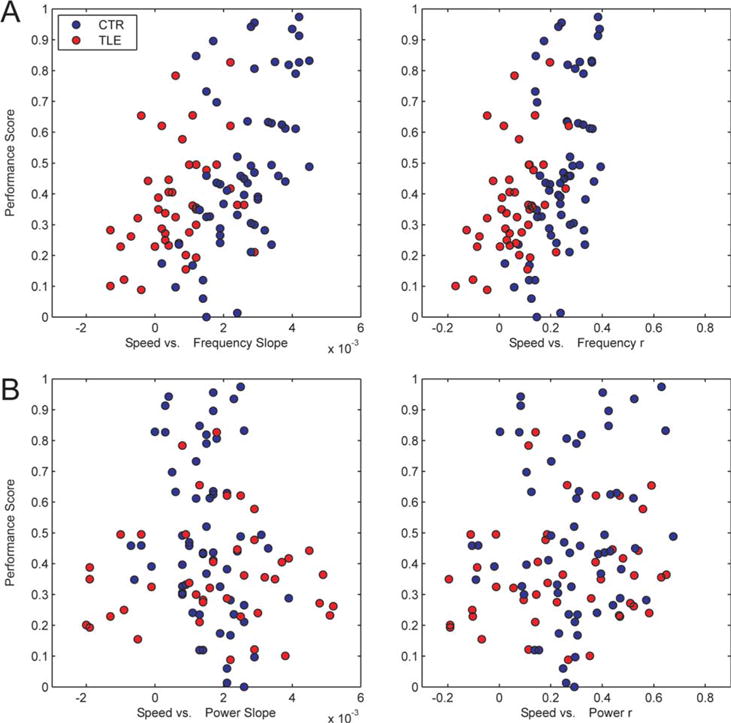
Speed-theta frequency, but not power relationships correlate with performance. A: Speed-theta Frequency slope (left) and correlation coefficients (r, right) for each session are plotted against the performance score in the session. B: Speed-theta Power slope (left) and r (right) vs. performance score in the same session. Each dot represents a recording session. CTR rats are represented in blue, TLE rats in red. [Color figure can be viewed in the online issue, which is available at wileyonlinelibrary.com.]