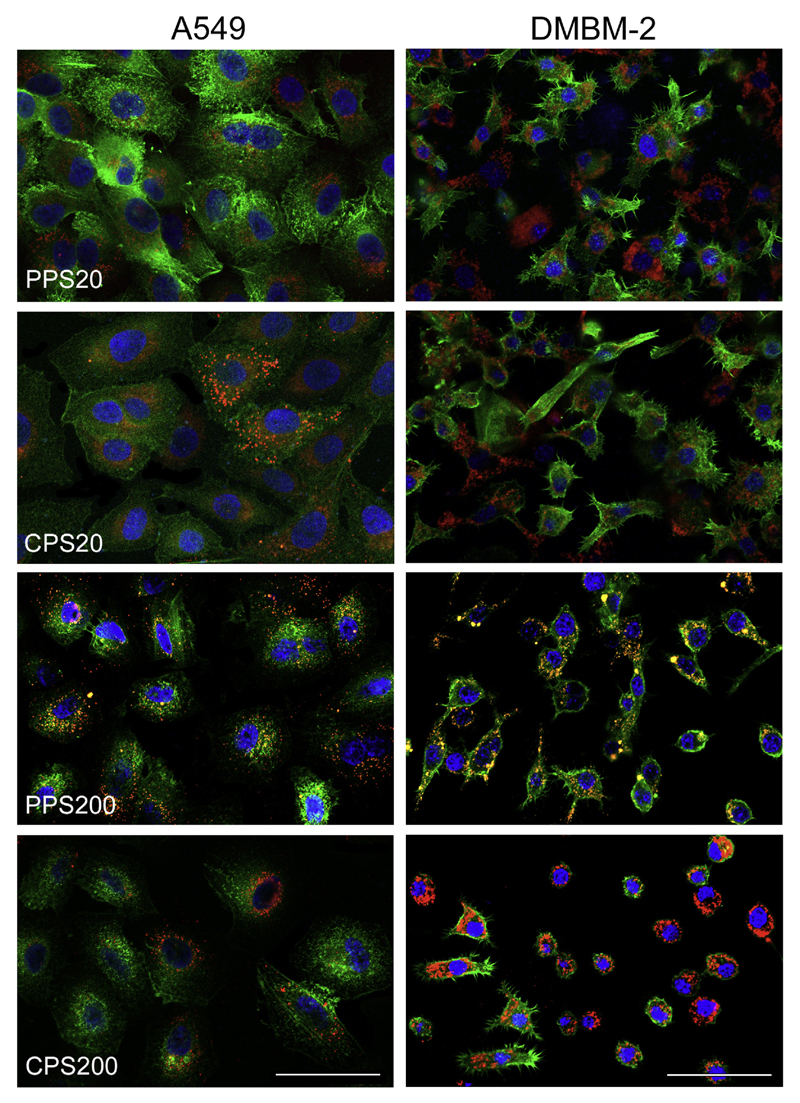
Fig. 5.
Cellular localization of particles after exposure in DMEM + 0% FBS for 24 h. Cells are identified by staining of actin with Alexa Fluor® 488-phalloidin (green) and particles are seen in red. Nuclei are counterstained with Hoechst 33342 (blue). Co-localization is indicated by yellow color. The intracellular localization of particles is easier to discern in A549 cells because the cells are larger and intensity of the phalloidin staining higher. Scale bar: 50 μm. (For interpretation of the references to colour in this figure legend, the reader is referred to the web version of this article.)

