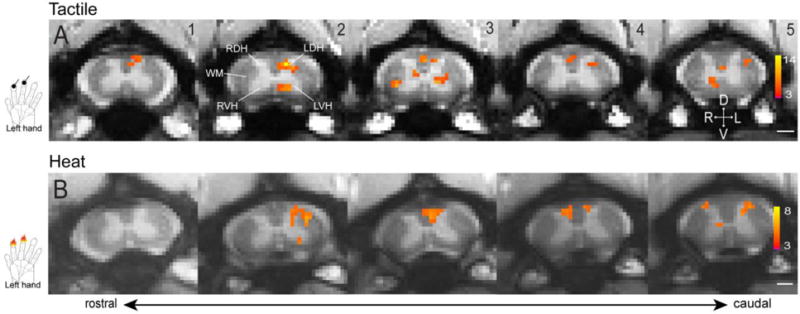
Figure 6.

Representative fMRI activations to tactile and nociceptive heat stimulation of two distal finger pads. (A) Multi-run average fMRI activations to tactile stimulation of two distal finger pads on left hand. (B) Multi-run average fMRI activations to 47.5 °C nociceptive heat stimulation of two distal finger pads on left hand. Hand inserts show the locations of stimulation. All activation maps are thresholded at p < 0.05 for multi-run with FDR (0.01) correction, see color scale bar on image 5 for the t value range. Images 1–5: from rostral to caudal. Scale bars indicate 1 mm. D: dorsal; V: ventral; L: left; R: right. Modified from (52).
