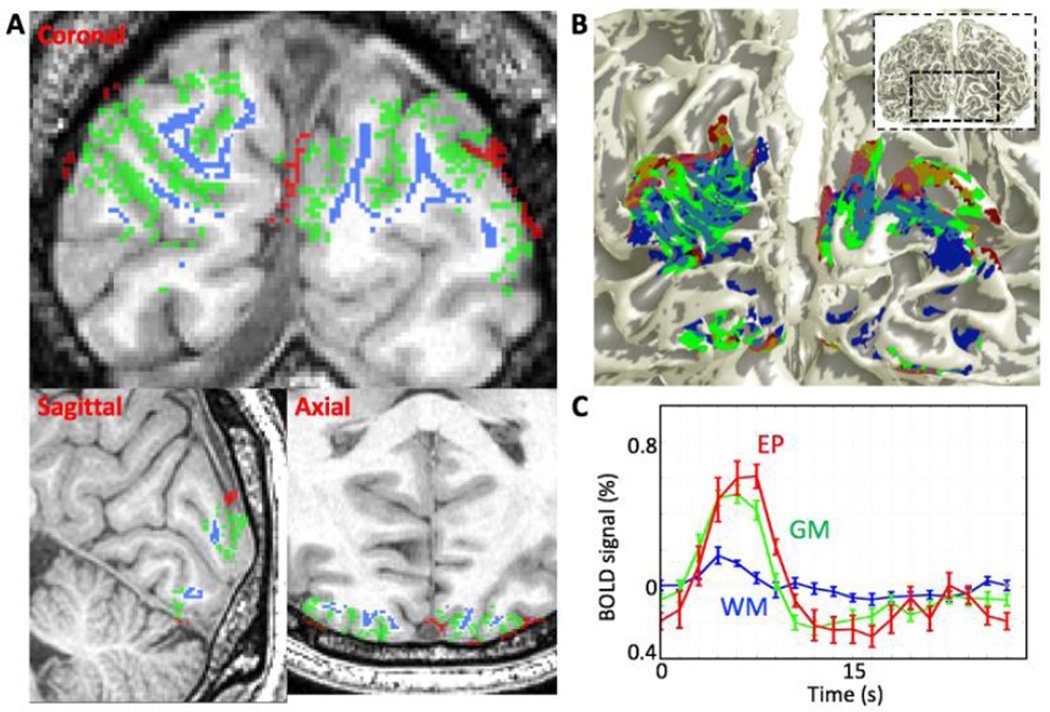
Figure 3.
A) Example of the region for top 50% of strong response voxels in each compartment on coronal, sagittal and axial slices: WM (blue), GM (green), EP compartments (red). To avoid partial volume effects, the voxels in the WM and EP compartments are separated by at least 0.9 mm from GM/WM interface and pial surface respectively. B) Overlaid selected voxels in each compartment onto 3D GM/WM interface. C) Mean time series of the selected region in each compartment. Error bars are 68% confidence intervals obtained using a bootstrapping scheme.

