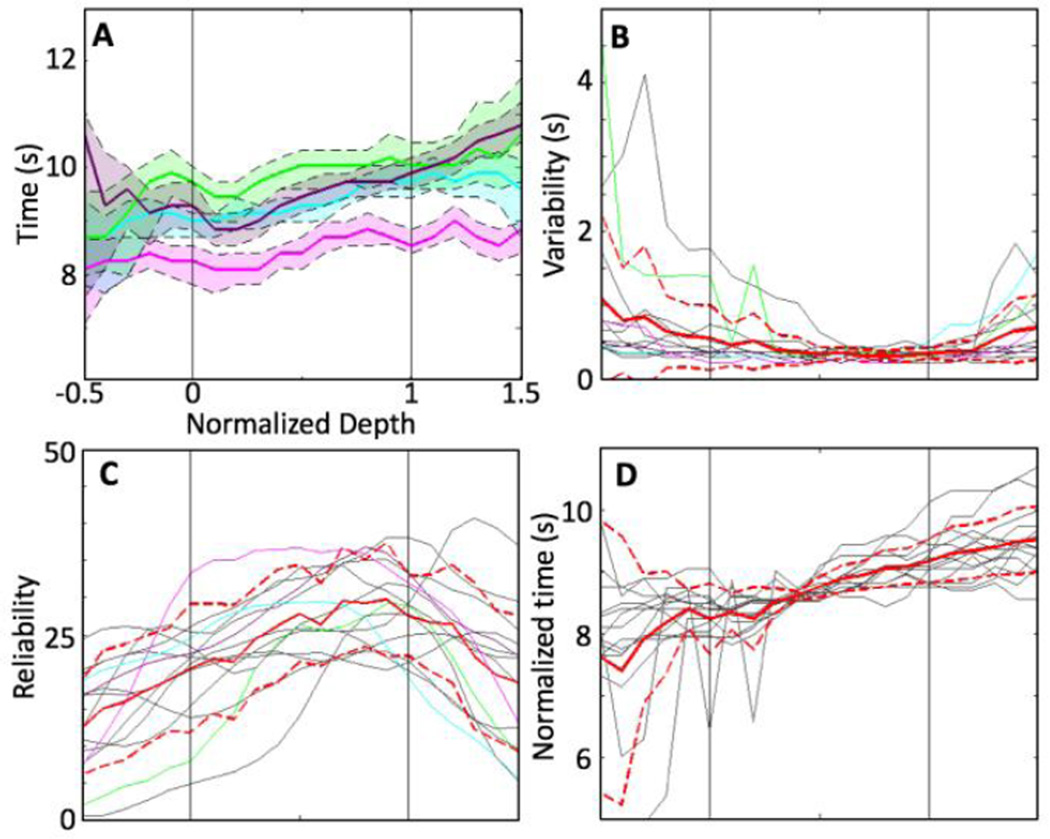
Figure 7.
Depth analysis of the time-to-offset. 15 depth profiles that have significant linear trends within the GM are used. A) Examples (colored lines) of variation of depth profiles. Shaded regions show 68% confidence interval within each example. B) Variability of the examples (colored lines) as well as all individual depth profiles (gray). C) Mean (red) and standard deviation (dashed red) of the reliability across ROIs and sessions. D) Depth profiles (gray) normalized by mean of the corresponding time-to-offset in the GM: mean (red) and standard deviation (dashed red) across ROIs and sessions.

