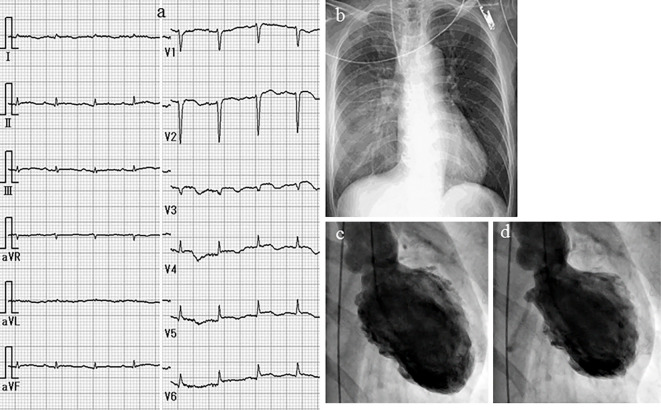
Figure 1.
The ECG findings. ECG shows sinus rhythm with a heart rate of 120 beats/min, low voltage, poor r wave progression in leads V1-3, a Q wave in lead V3, slight ST segment elevation in leads V2-5, and a negative T wave in leads V2-5 (a). A chest X-ray in the supine position shows right pleural effusion and pulmonary congestion (b). Left ventriculography (LVG) shows severe hypokinesis of the middle segment and apex and the preserved contraction of the basal segment of the left ventricle (c: end-diastolic phase, d: end-systolic phase).

