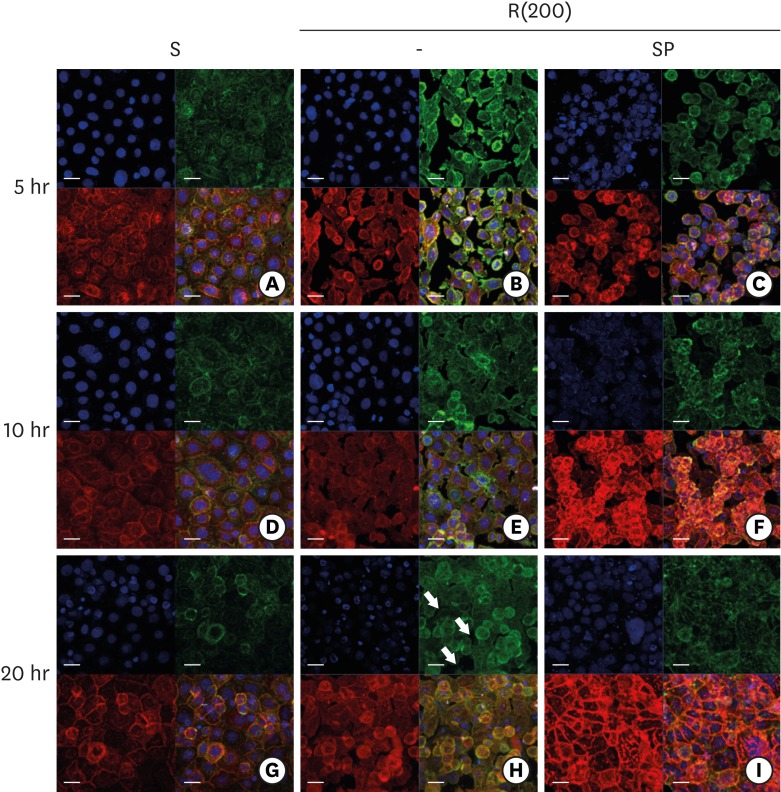
Figure 5.
ECJ development in HGKs seeded at a high density on smooth or rough substrates was examined using confocal laser-scanning microscopy. ECJ development was followed by immunocytochemical staining for the expression level of E-cadherin (red) at 5, 10, and 20 hours after cell seeding. F-actin (green) was stained with FITC-phalloidin. Nuclei were stained with DAPI (blue). The lower right picture in each set of 4 pictures is a merged image of the E-cadherin, F-actin, and nuclei images. (A, D, G) Cells on the smooth substrates were cultured under normal conditions. Cells on the rough substrates with high-nanometer dimensions, R(200), were cultured under normal conditions (B, E, H) or JNK inhibition by 1 µM SP (C, F, I). (H) Arrows indicate the wide intercellular gaps remaining between the cells on the rough substrate with a high-nanometer dimension despite the high density of the culture (bar=20 µm). Ra=867.0±168.6 nm for R(200).
ECJ: E-cadherin junction, HGK: human gingival keratinocyte, FITC: fluorescein isothiocyanate-labeled, DAPI: 4′, 6-diamidino-2-phenylindole dihydrochloride, JNK: c-Jun N-terminal kinase, S: smooth substrate, SP: SP600125, Ra: average roughness, R(200): prepared with #200 sandpaper.

