Figure 7.
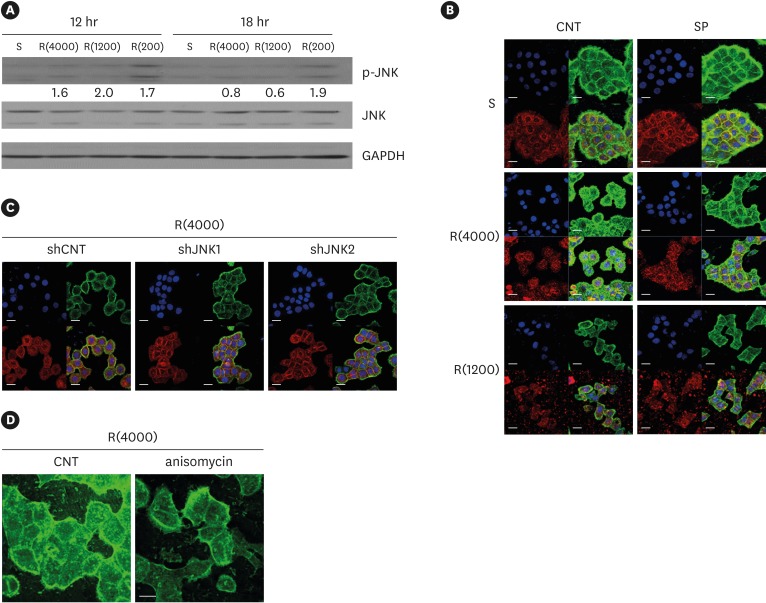
Influence of JNK on ECJ development. (A) HGKs were cultured on substrates with varying levels of roughness. Then, the expression levels of p-JNK were compared by western blotting. Values under the blots for p-JNK indicate the relative expression level of p-JNK to the total JNK for each group, which was analyzed using Image J. (B) HGKs were treated with SP (1 µM) to inhibit JNK activity for 24 hours in culture starting 12 hours after cell seeding on the smooth and rough substrates. CNT indicates the control culture without treatments with SP. (C) HGKs transfected using lentiviruses expressing shJNK1/2 to selectively inhibit JNK1/2 activity were re-plated for 24 hours on the rough substrate with low-nanometer dimensions (Ra=121.3±13.4 nm). ECJ development was followed by immunocytochemical staining for the expression level of E-cadherin (red). F-actin (green) was stained with FITC-phalloidin. Nuclei were stained with DAPI (blue). The lower right picture in each set of 4 pictures is a merged image of the E-cadherin, F-actin, and nuclei images. shCNT, scrambled shRNA. (D) HGKs were treated with anisomycin (20 ng/mL) to activate JNK for 20 hours in culture starting 3 days after cell seeding on the rough substrates. CNT indicates the control culture without treatments with anisomycin (bar=20 µm). Ra=121.3±13.4, 505.3±115.3, and 867.0±168.6 nm for R(4000), R(1200), and R(200), respectively.
S: smooth substrate, SP: SP600125, JNK: c-Jun N-terminal kinase, ECJ: E-cadherin junction, HGK: human gingival keratinocyte, CNT: carbon nanotube, Ra: average roughness, p-JNK: phospho-c-Jun N-terminal kinase, shRNA: small hairpin RNA, FITC: fluorescein isothiocyanate-labeled, DAPI: 4′, 6-diamidino-2-phenylindole dihydrochloride, R(4000): prepared with #4000 sandpaper, R(1200): prepared with #1200 sandpaper, R(200): prepared with #200 sandpaper.

