Figure 8.
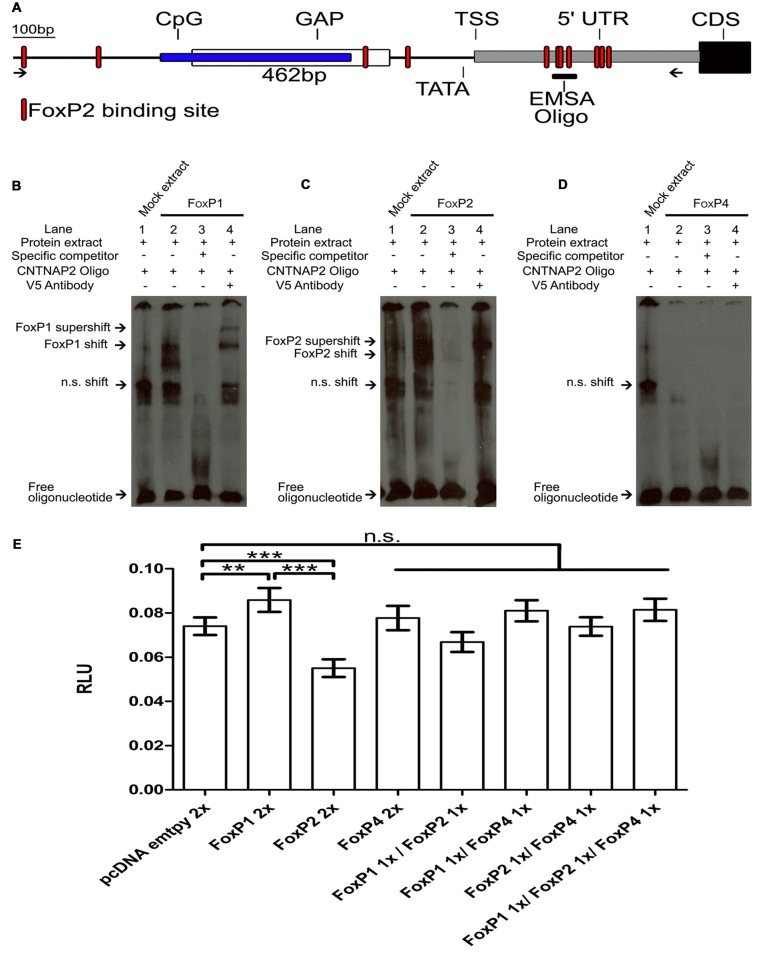
FoxP1 activated, FoxP2 repressed and FoxP4 did not bind or regulate the Contactin-associated protein-like 2 (CNTNAP2) promoter. (A) Schematic of the CNTNAP2 promoter region. Arrows show the region of the primers used to clone the CNTNAP2 promoter region. The location of the predicted transcription start site (TSS), TATA-box, CpG island (blue box), GAP (white box), 5′ UTR (gray box), coding sequence (CDS, black box) and FOXP2 binding sites (red shapes) are denoted by lines. The fragment used for the EMSA experiments (described in Adam et al., in review) is illustrated by the vertical line labeled “EMSA oligo” on the 5′ UTR region. DNA binding assays with FoxP1 (B), FoxP2 (C) and FoxP4 (D) with the CNTNAP2 oligo. Nuclear extracts (1 μg) from HeK293 cells were incubated with the digoxigenin labeled probe (0.8 ng) representing the 46-bp of the CNTNAP2 FoxP2 binding site. Shown in each case are protein lysate of HeK293 cells transiently transfected with empty vector and labeled probe (lane 1), shift in the presence of nuclear extract of FoxPs (lane 2), and complex formation in the presence of 200-fold molar excess of specific un-labeled probe (lane 3) and supershift in the presence of labeled probe, FoxPs protein extract and monoclonal V5 antibody (1 mg/ml; lane 4). In all cases arrows point at free oligo, non specific shift (n.s.), FoxP shift and supershift. (E) Luciferase assays were carried out in HeK293 cells to measure effects of FoxP1/2/4 alone or in combinations on the CNTNAP2 promoter. Significance levels from all combinations to the empty vector control are represented by asterisks, **p < 0.001–0.01; ***p < 0.001. One way ANOVA; F = 21.66; DF = 7 and n = 8; followed by a Tukey’s multiple comparison test. FoxP1 and FoxP2 single transfections significantly activated or repressed the pGL4-CNTNAP2 transcriptional activity through a specific DNA-binding site in the CNTNAP2 promoter (One way ANOVA; Tukey’s multiple comparison test; **P < 0.005; ***P < 0.0001). FoxP4 as well as all other combinations did not regulate the CNTNAP2 promoter. Bars show mean of means ± SEM of seven independent transfections presented as luciferase/renilla ratio (RLU), corrected for transfection by pGL4.75 Renilla luciferase activity. 1× = 125 ng of overexpressing vector pro well, 2× = 250 ng of overexpressing vector per well. The control transfection value was obtained with the empty expression vector (pcDNA3.1).

