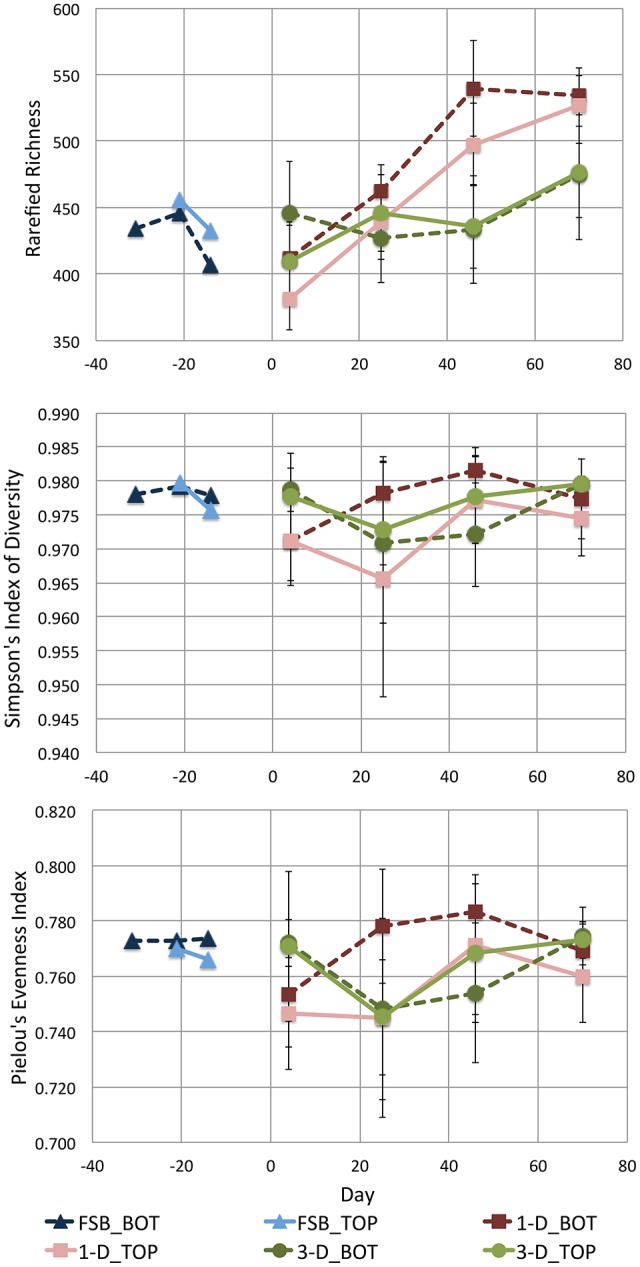
Figure 10.

Scatter plots showing time-series for mean rarefied richness, diversity, and evenness in each of the full-scale (FSB) and laboratory-scale (1-D and 3-D) sample sets; error bars show standard deviation. In each case, indices are calculated using samples grouped to represent the microbial community at the top (_TOP) and bottom (_BOT) of the sludge bed in each reactor type.
