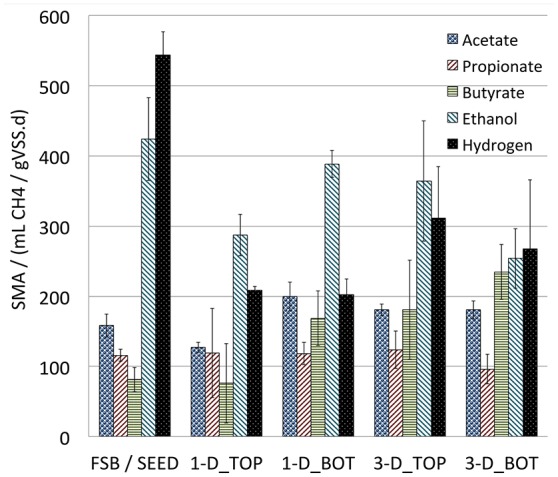
Figure 3.

Grouped bar plot showing SMA recorded in biomass from full-scale (SEED) and laboratory-scale bioreactors at the beginning (SEED) and end of the trial at the top (_TOP) and bottom (_BOT) of the sludge beds against specific substrates: acetate, propionate, butyrate, Ethanol, and hydrogen. Bars show blank-adjusted mean and error bars show standard deviation of triplicate measurements.
