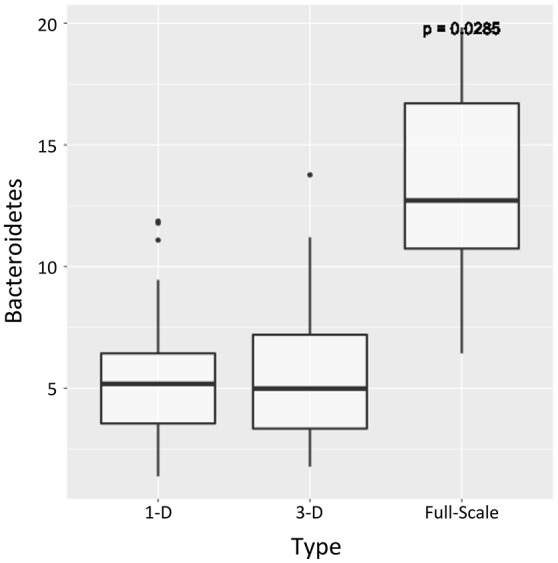
Figure 8.

Boxplot showing relative abundance (%) across each sample set for the phylum Bacteroidetes, the relative abundance of which was significantly greater at full-scale than at laboratory -scale (Kruskal–Wallis with Benjamini–Hochberg correction on p-value, p < 0.05). The bands show the median value for each group; bottom and top of boxes show the first and third quartiles; and whiskers show maximum and minimum values with 1.5 of IQR of upper and lower quartiles.
