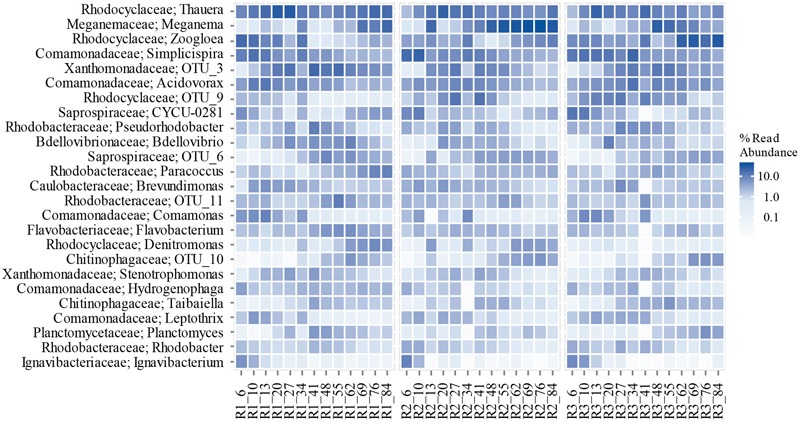
FIGURE 7.

Temporal variation of the most abundant genera in the reactors. The labels on the x-axis refer to the reactor and the days of operation since start-up. (OTU_3, OTU_6, OTU_9, OTU_10, and OTU_11 were unclassified on the genus level.)

Temporal variation of the most abundant genera in the reactors. The labels on the x-axis refer to the reactor and the days of operation since start-up. (OTU_3, OTU_6, OTU_9, OTU_10, and OTU_11 were unclassified on the genus level.)