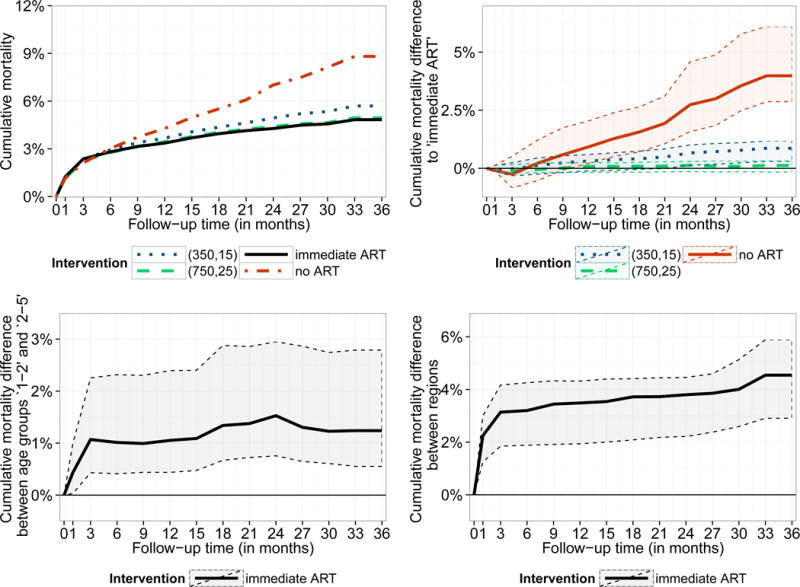
Figure 3.

Estimated cumulative mortality by intervention strategy (top left) and differences between these intervention strategies (top right). For the intervention ‘immediate ART’ cumulative mortality differences are displayed for both comparing the two different age groups and regions (bottom panel). Results are based on g-computation and 95% bootstrap confidence intervals are represented by the shaded area.
