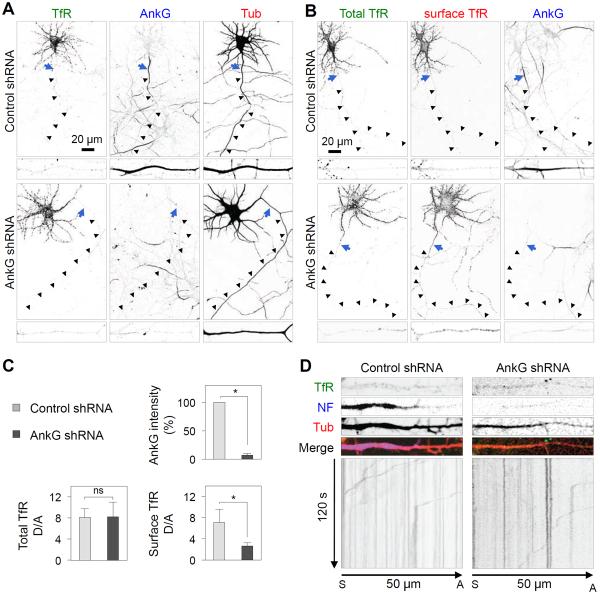
Figure 3. Axonal exclusion of somatodendritic vesicles in the absence of the AIS.
(A) DIV3 neurons were co-transfected with plasmids encoding control shRNA or AnkG shRNA, together with TfR-GFP and mCherry-tubulin, and stained for AnkG on DIV8. (B) DIV3 neurons co-transfected with plasmids encoding control shRNA or AnkG shRNA, together with TfR-GFP, were surface-stained live with CF555-conjugated antibody to GFP prior to fixation and staining for AnkG on DIV8. Enlarged regions of axon are shown at the bottom of each image. Arrows indicate the position of the AIS and arrowheads trace the trajectory of the axon. (C) Graph representing AnkG intensity (%) and dendrite/axon (D/A) ratio for total and surface TfR-GFP quantified from 20 neurons and expressed as mean ± SD. * P<0.001. n.s., not significant. (D) Images of axons from live DIV8 neurons transfected as in A and stained for NF. Grayscale kymographs for TfR-GFP recorded every 500 ms for 120 s were generated from a straightened 30-pixel-wide line along a 50-μm path of an axon. Particles moving in retrograde direction appear as lines with positive slopes. See also Movie S3.

