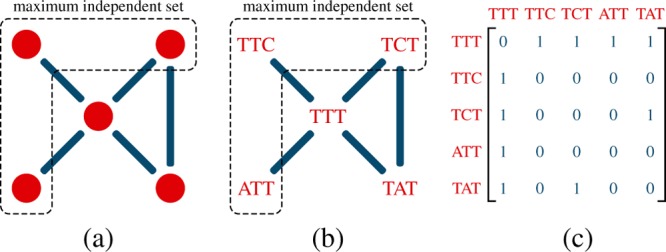
Figure 3.

Concept of the graph-theoretical approach. (a) Vertices of one graph (red circles) along with the edges (blue lines) between adjacent vertices. The vertices inside of the dashed area form the maximum independent set. (b) Sequences that are connected by blue lines lead to cross-hybridization. ATT, TTC, and TCT are generating the maximum independent set. (c) Adjacency matrix for the corresponding set of sequences.
