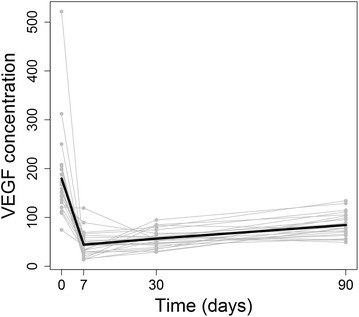
Fig. 1.

Line graph showing that the mean vascular endothelial growth factor (VEGF) levels were significantly lower at all follow-up periods as compared to the baseline measurement. The lowest VEGF concentration was observed one week after treatment. The light gray lines represent the VEGF concentration of each study eye (total of 24 eyes) and the black line represents the mean VEGF concentration of all study eyes
