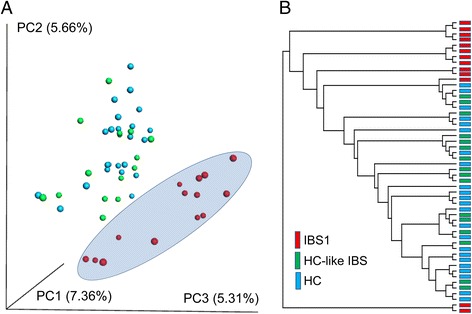
Fig. 1.

16s rRNA gene data revealed two distinct IBS subgroups, one indistinguishable from healthy controls. a Principal coordinate analysis (PCoA) on the unweighted Unifrac distance matrix from the rarefied data was used to evaluate the presence of clusters or groupings based upon operational taxonomic unit (OTU)-level microbial features. b Hierarchical clustering using average linkage was performed to visualize relationships among the samples based on similarity of microbial composition. Both procedures operate on a phylogenetically informed distance matrix computed using the unweighted UniFrac metric
