Fig. 3.

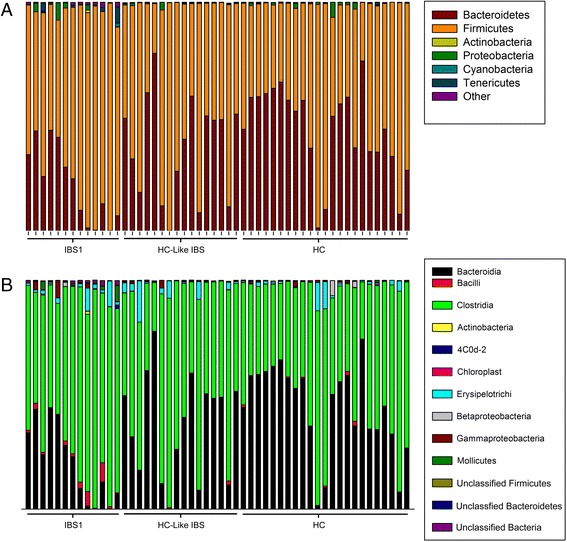
Microbial composition of each sample by group at the phylum and class level. Stacked vertical bar charts depict the variability in phyla- and class-level composition for individuals by groups

Microbial composition of each sample by group at the phylum and class level. Stacked vertical bar charts depict the variability in phyla- and class-level composition for individuals by groups