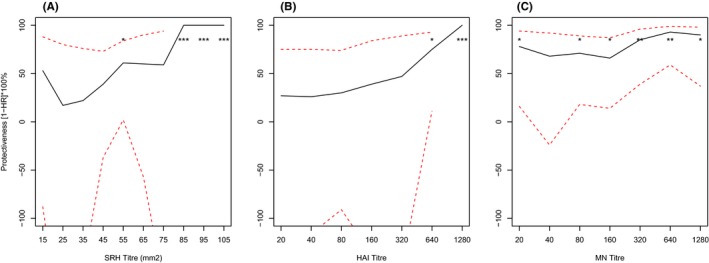
Figure 1.

SRH titre value has the worst correlation with protection against influenza, as the estimates of protective efficacy fluctuated when the cut‐offs of SRH titre value increased. The estimates of protective efficacy for MN were relatively stable and consistently higher than those of both SRH and HAI . Protective effectiveness against PCR‐confirmed influenza was compared at different SRH, HAI and MN titre cut‐offs for seasonal H3N2 (A/Brisbane/10/2007). The hazard ratio (HR) represents the risk at cut‐offs greater than or equal to a given titre, relative to levels less than the cut‐off, and was calculated using Cox's proportional hazards model, adjusting for participant colony using a robust sandwich estimator. Dotted lines represent the 95% confidence interval and P‐values were calculated using standard error estimates from the regression model. **, P<.01; *, P<.05.
