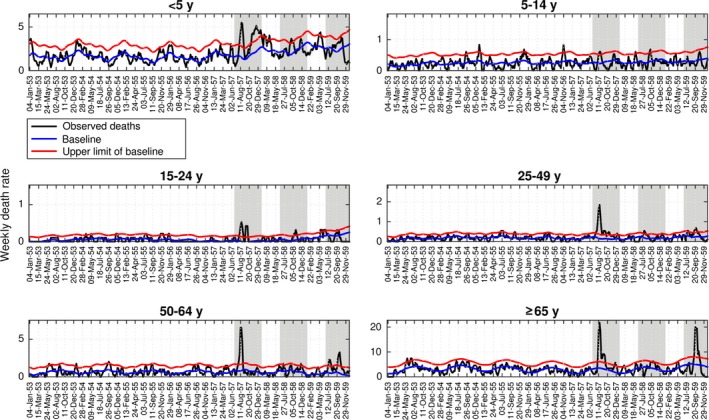
Figure 3.

Age‐stratified weekly respiratory mortality rates per 10 000 in the city of Concepcion, Chile, 1953‐1959 (black curve). Shaded areas highlight three winter periods (Jun‐Dec) during 1957‐1959. The Serfling seasonal regression model baseline (blue curve) and corresponding upper limit of the 95% confidence interval of the baseline (red curve) are also shown. Excess deaths are above the upper limit of the baseline mortality curve calibrated using mortality levels prior to the 1957 influenza pandemic
