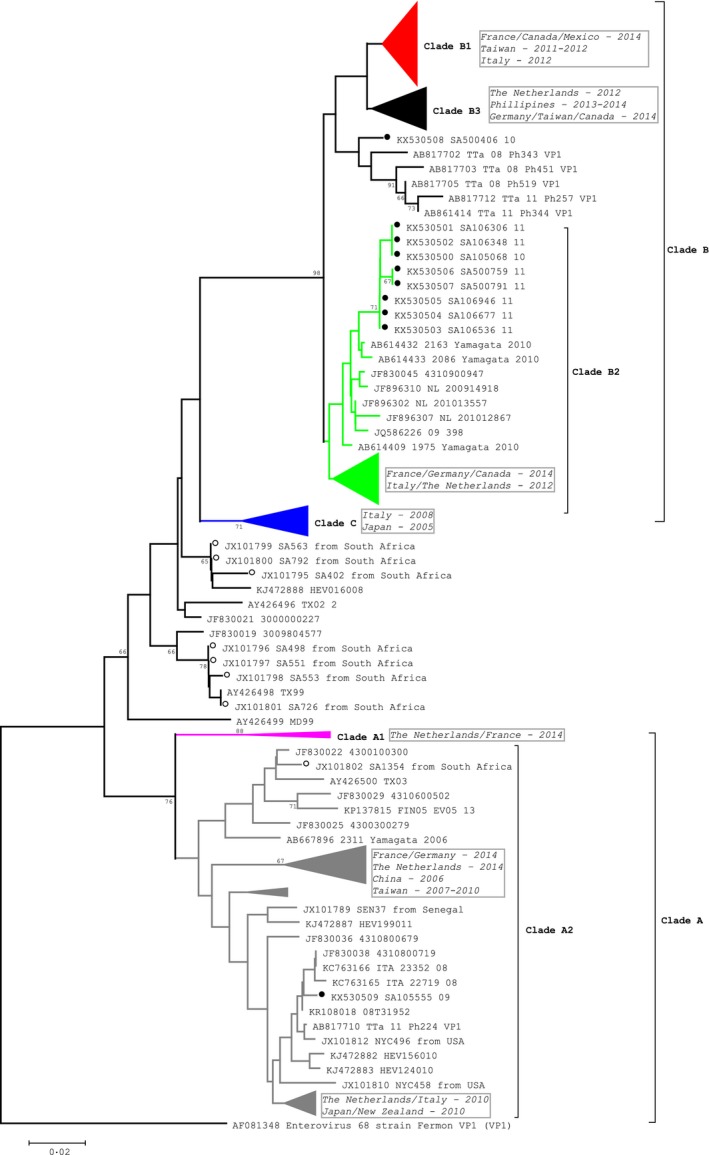
Figure 3.

Molecular characterization of EV‐D68 clinical samples based on phylogenetic analysis of nucleotide sequences of the partial VP1 genomic region. Trees were constructed using neighbour‐joining methods as implicated in mega 5 software (http://www.megasoftware.net). Bootstrap values from 1000 replicates are shown on the nodes. Scale bar indicates number of nucleotide substitutions per site. Black dots=South African strains 2009‐2011; Open dots=South African strains 2000‐2001. Clades B1, B3, C A1 and partial B2 and A2 have been compressed to show comparison of South African strains to strains from other countries (country and year in blocks). Total number of sequences=312 (representative strains from 2000 to 2016)
