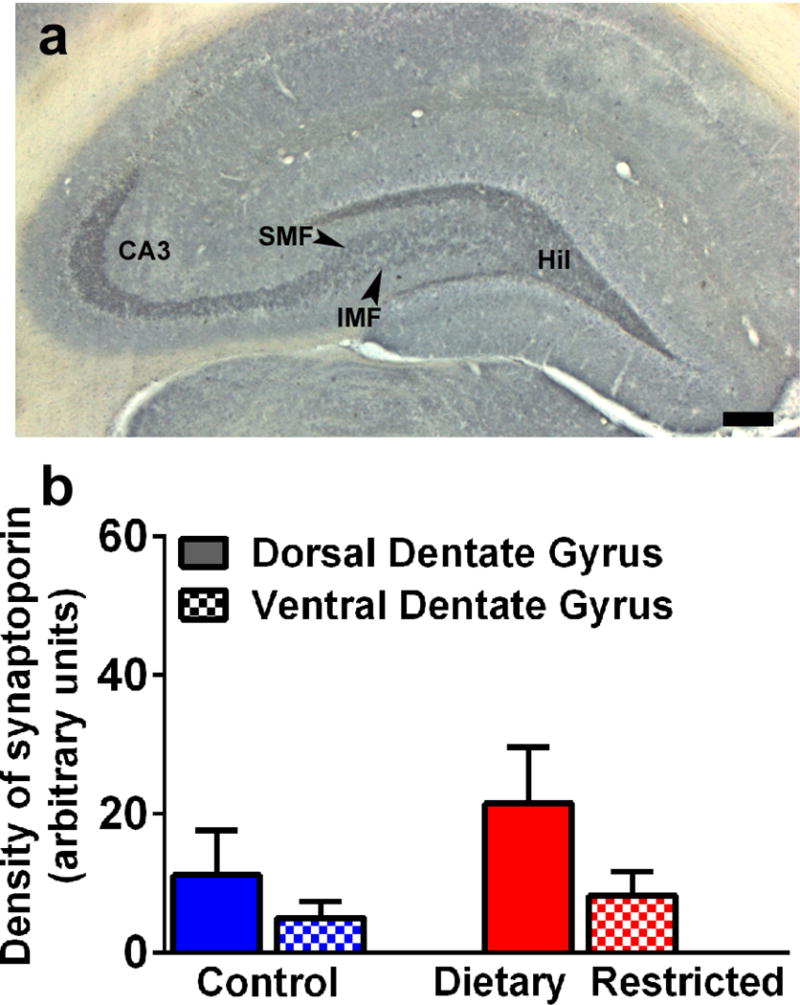
Figure 5.

Photomicrograph showing mossy fiber projections via staining for synaptoporin in the dorsal dentate gyrus (a). Staining for synaptoporin was evident in the hilus (Hil), CA3 region, with infrapyramidal mossy fibers (IMF) and suprapyramidal mossy fibers (SMF) indicated in the hilus region. Scale bar in (a) is 100 μm. Densitometric analysis of mossy fiber projections in the dorsal and ventral dentate gyrus (b). Data is represented as mean ± SEM.
