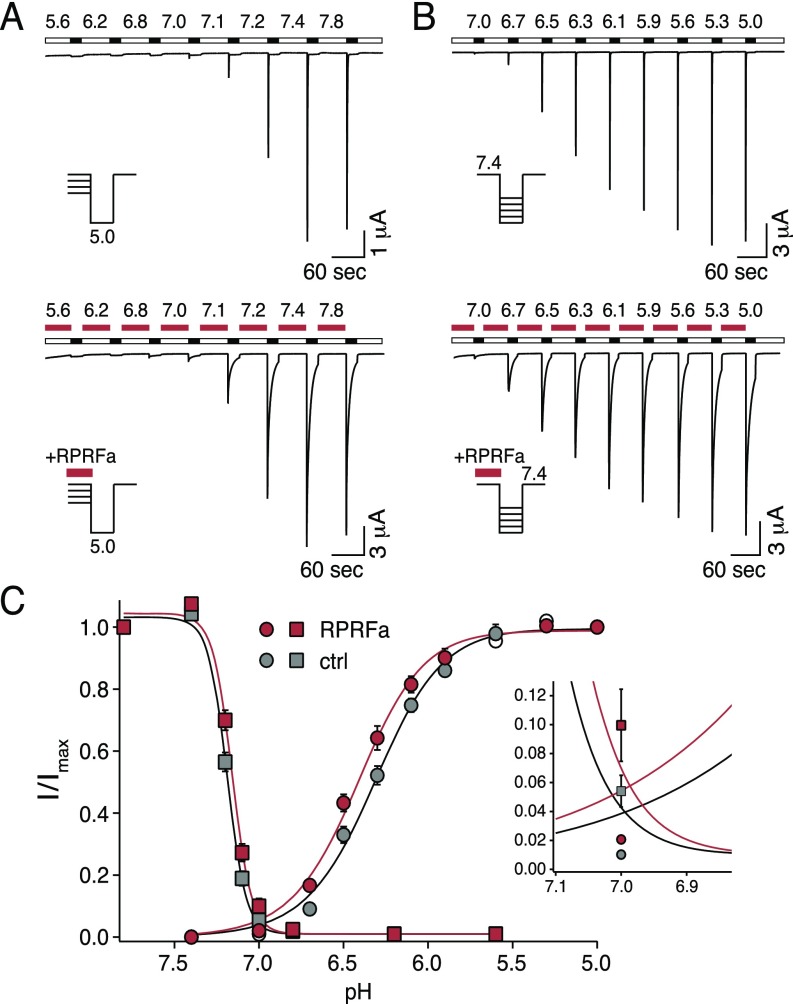
Fig. S3.
RPRFa slightly shifts curves of H+ activation and steady-state desensitization. (A) Representative current traces of ASIC3, illustrating current amplitudes at different conditioning pH without (Top) and with RPRFa (10 μM; red bars) (Bottom). Activation was with pH 5.0. (B) Representative current traces of ASIC3, illustrating activation by different pH without (Top) and with RPRFa (10 μM; red bars) (Bottom). Conditioning pH was 7.4. (C) Quantification of peak current amplitudes at different pH values, normalized to the amplitude at conditioning pH 7.8 (steady-state desensitization) or pH 5.0 (activation), respectively (n = 10). The “window current” of ASIC3 is shown on an expanded scale. RPRFa would slightly increase window currents.

