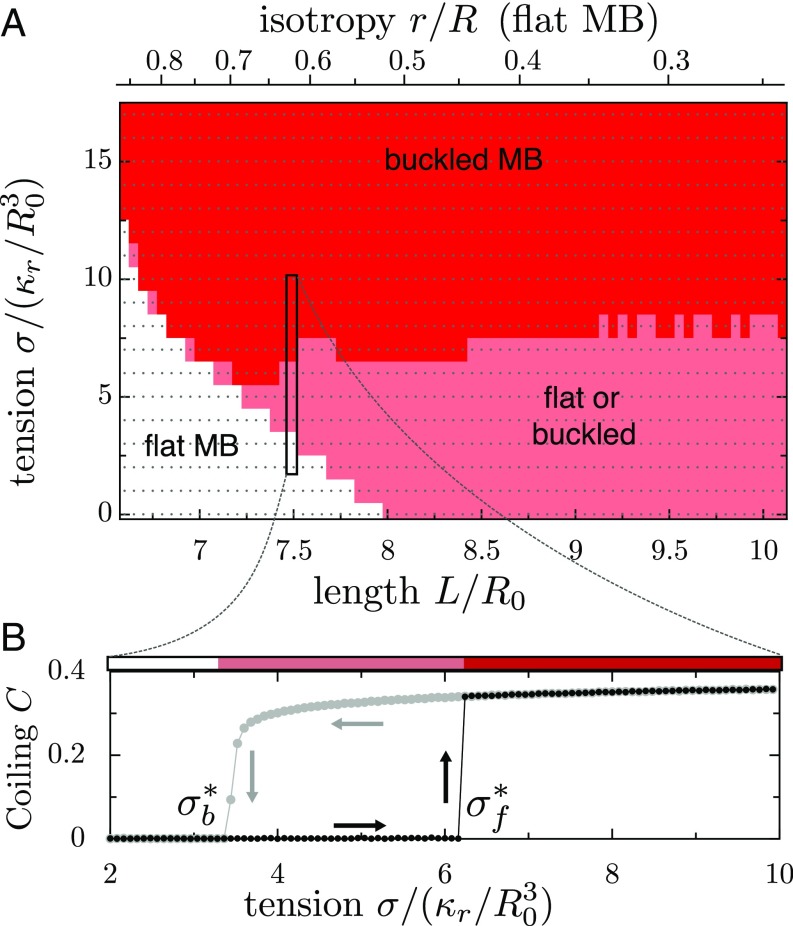
Fig. 5.
(A) The equilibrium configuration of the MB is calculated as a function of renormalized tension and renormalized MB length , in which the volume of the cell is . The gray dots indicate the simulations performed to calculate the diagram. The configuration of the MB is indicated by colors: white, flat; red, buckled; and pink, bistable (i.e., buckled or flat). The topmost scale indicates the shape parameter of the cell (isotropy ), at equilibrium in the case where the MB is flat and has a length equal to the cell perimeter. (B) A cut through the phase diagram, for a MB of length . The degree of coiling (see Methods for definition) is indicated as a function of tension, for a cell that is initially flat (black dots) or buckled (gray dots). In the metastable region, the two trajectories are separated, and the arrows illustrate hysteresis in the system.

