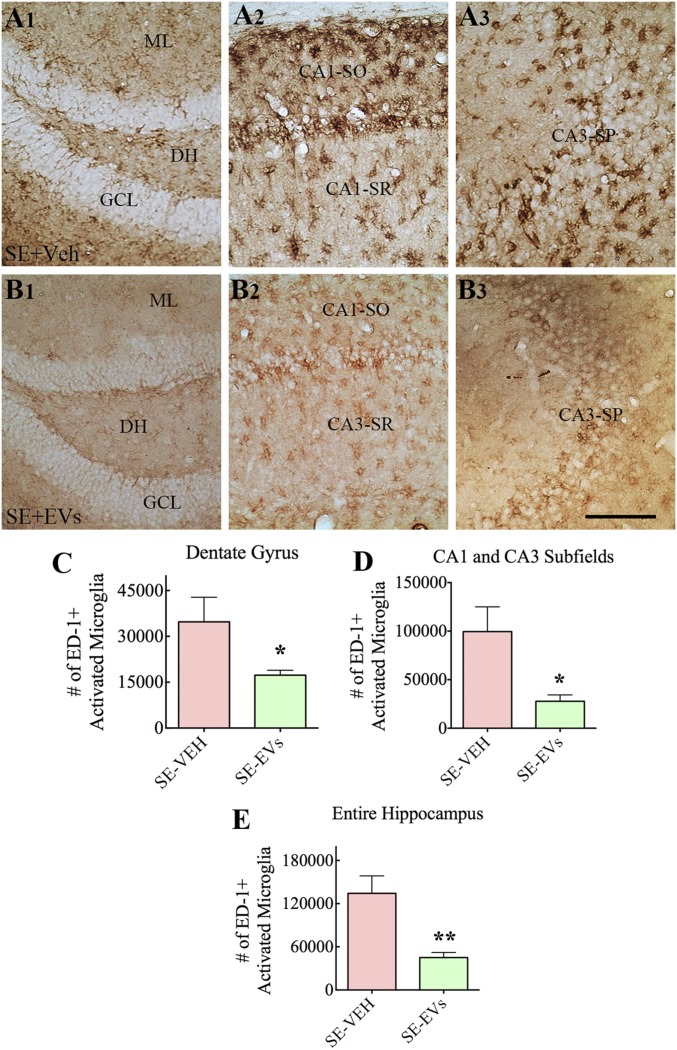
Fig. 3.
IN administration of A1-exosomes 2 h after SE greatly reduces the density of ED-1+ (CD68+) activated microglia in the hippocampus when examined 4 d post-SE. (A1–B3) Distribution of ED-1+ activated microglia in the DG (A1 and B1), the CA1 subfield (A2 and B2), and the CA3 subfield (A3 and B3) of an animal in the SE-VEH group (A1–A3) and an animal in the SE-EVs group (B1–B3). ML, molecular layer; SO, stratum oriens; SP, stratum pyramidale; SR, stratum radiatum. Bar charts in C–E compare the numbers of ED-1+ microglia in the DG (C), CA1 and CA3 subfields (D), and the entire hippocampus (E). Note that animals receiving A1-exosomes (i.e., SE-EVs group) display reduced numbers of ED-1+ activated microglia compared with animals in the SE-VEH group (*P < 0.05 and **P < 0.01). (Scale bar: 100 µm.)

