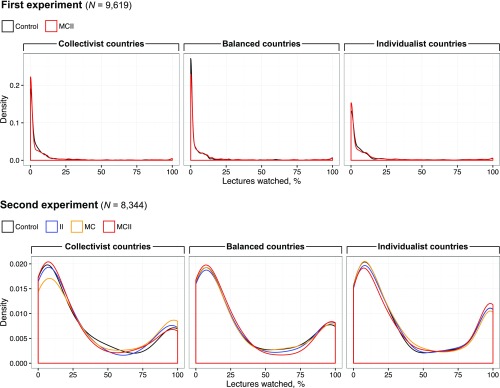
Fig. S1.
Course persistence in terms of the percentage of lectures watched in two randomized experiments. The figure shows the distribution density of course persistence for each experimental condition (line color) in three cultural contexts (horizontal facets). Cultural context is defined at a national level based on the Hofstede collectivism–individualism index: collectivist countries [0, 33], balanced countries [34, 66], and individualist countries [67, 100]. In the first experiment, the density lines are visually indistinguishable due to high zero-inflation and overdispersion.

