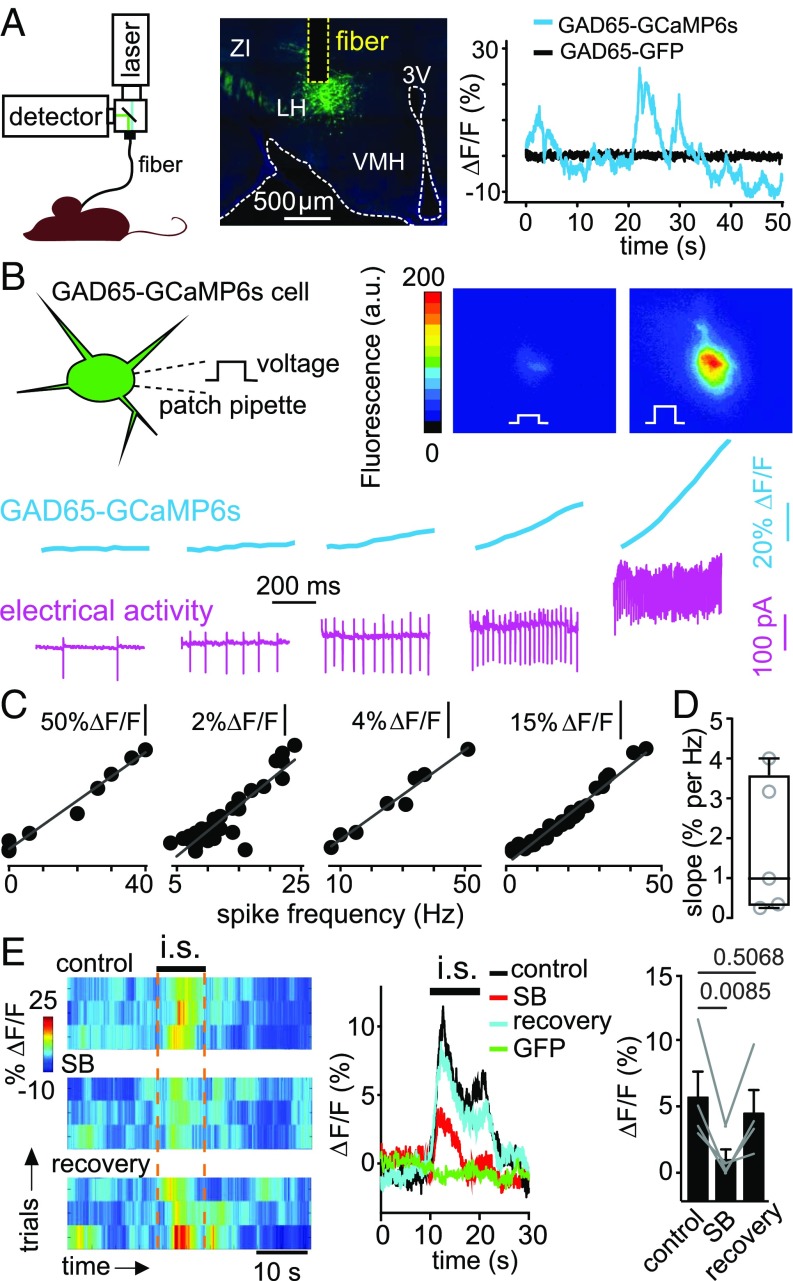
Fig. 2.
Stress-induced, orexin-dependent control of GAD65LH cells in vivo. (A, Left) Schematic of fiber photometry recording. (A, Center) GCaMP6s expression in GAD65LH cells, and localization of recording site and optical fiber (representative example of five brains). (A, Right) Example fluorescence trace during free cage exploration for mice expressing GCaMP6s (blue) or EGFP (black) in GAD65LH neurons (typical examples of n = 5 and n = 5 mice, respectively). (B) Simultaneous measurement of membrane electrical activity and calcium level in GAD65LH-GCaMP6s cells. (Top) Schematic of recording and examples of two video frames from a cell injected with depolarizing current steps. (Bottom) Example of simultaneous cell-attached and fluorescence recording from a GAD65LH cell (typical example of n = 5 cells). (C) Examples of quantification of data in B, showing the linear relationship between calcium level and spike frequency in four different cells. (D) Group plot of slopes (taken from linear regression fits) of relations between spike frequency and calcium level (n = 5 cells). (E, Left) GAD65LH-GCaMP6s signals aligned to immobilization stress (i.s.). Heat maps of individual trials from one mouse, in the presence and absence of orexin receptor antagonist SB-334867 (SB; 30 mg/kg i.p.; Materials and Methods), representative example of n = 4 mice. (E, Center) Averaged data for bouts such as those bouts shown on the left. Each trace is the average response of n = 4 mice (each n is a mean of four trials such as those trials shown on the left). The GFP trace shows responses of GAD65-GFP mice (negative controls). (E, Right) Mean calcium signals during i.s. (10–20 s) per mouse (each point represents one mouse, n = 4 mice). One-way repeated measures ANOVA: F(2,6) = 11.61; P = 0.0087, P values on the plot are from Tukey’s posttests.

