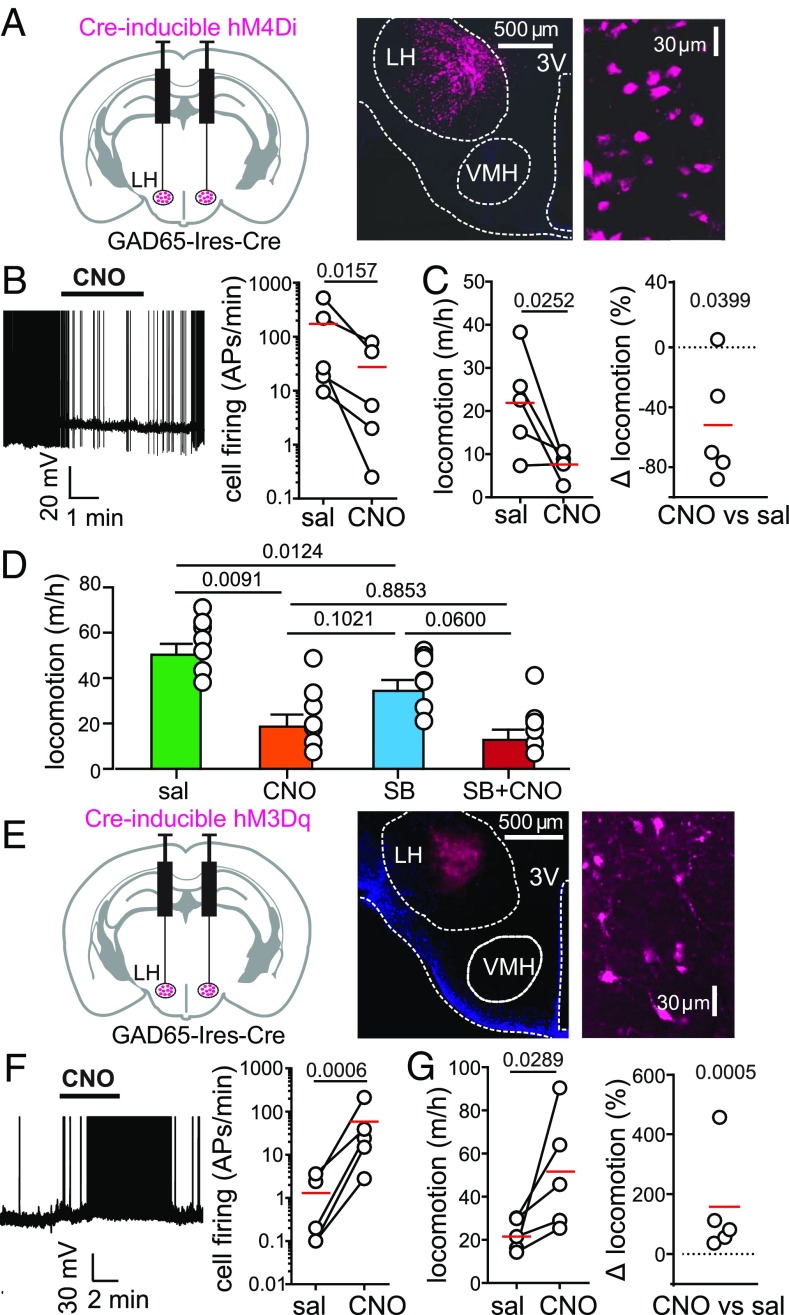
Fig. 3.
Effect of natural and evoked GAD65LH cell activity on locomotion. (A, Left) Targeting scheme for hM4Di-mCherry. (A, Center) Localization of hM4Di-mCherry. (A, Right) GAD65LH-hM4Di-mCherry cells at high zoom (representative example of five brains). (B, Left) Effect of CNO on GAD65LH-hM4Di cell firing. Spikes are truncated at 0 mV (representative example of n = 5 cells). (B, Right) Group data, raw values, and means (red); the on-plot P value is from a one-tailed, ratio-paired t test (t, df = 3.251, 4) (n = 5 cells). APs, action potentials. (C) Effect of CNO on locomotion of GAD65LH-hM4Di mice. Raw data and means are shown in red (Left), and the same data are shown as % change (Right). On-plot P values are from a one-tailed paired t test (t, df = 2.767, 4; Left) and from a two-tailed one-sample t test (t, df = 3.001, 4; Right) (n = 5 mice). Corresponding negative control data are described in Results. (D) Effects of SB-334867 (30 mg/kg i.p.; Materials and Methods) on locomotion of GAD65LH-hM4Di mice in the absence and presence of CNO. Repeated measures one-way ANOVA with Geisser–Greenhouse correction [F(1.977,11.86) = 16.15; P = 0.0004, on-plot values are P values from Tukey’s multiple comparison tests]. (E, Left) Targeting scheme for hM3Dq-mCherry. (E, Center) Localization of hM3Dq-mCherry. (E, Right) GAD65LH-hM3Dq-mCherry cells at high zoom (representative example of five brains). (F, Left) Effect of CNO on GAD65LH-hM3Dq cell firing. Spikes are truncated at 0 mV (representative example of n = 5 cells). (F, Right) Group data, raw values, and means (red); on-plot P value is from a one-tailed ratio-paired t test (t, df = 8.043, 4; n = 5 cells). (G) Effect of CNO on locomotion of GAD65LH-hM3Dq mice. Raw data and means are shown in red (Left), and the same data are shown as % change (Right). On-plot P values are from a one-tailed paired t test (t, df = 2.638, 4; Left) and from a two-tailed one-sample t test (t, df = 10.31, 4; Right) (n = 5 mice). Corresponding negative control data are described in Results.

