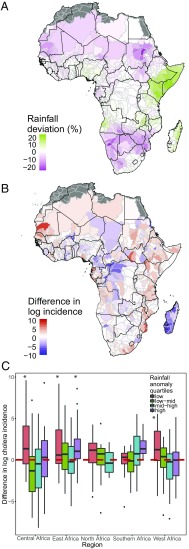
Fig. 3.
Association between cholera and rainfall by river basin. (A and B) River basin-level rainfall anomalies (anomalies smaller than ±5% not shown) (A) and (log) cholera anomalies (B) between El Niño and non-El Niño years. (C) River basin-level cholera incidence anomalies by region and the strength of rainfall anomalies. Positive cholera anomalies are associated with negative rainfall anomalies (lowest quartile) in every region and positive rainfall anomalies (highest quartile) in East and Southern Africa. *The difference in log cholera incidence between El Niño and non-El Niño years for a given rainfall anomaly quartile and geographical region is significantly different from the difference in log incidence for areas within that region with rainfall anomalies that fall in the low to mid or mid to high ranges (second and third quartiles).

