Fig. 4.
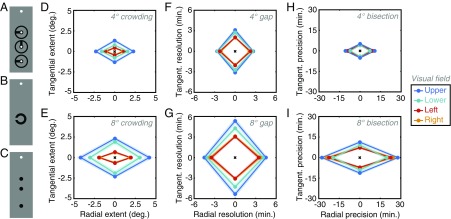
Stimuli and results from experiment 2. (A) Clock stimuli from the crowding task, shown with the white fixation circle. (B) Landolt-C stimuli used in the gap-resolution task. (C) Three-dot stimuli used in the bisection task. (D) Mean crowding zone sizes for all participants (n = 10) for both radial and tangential dimensions at 4° eccentricity for all visual-field locations (see color legend). Shaded regions show SEM across participants. (E) Mean crowding zones at 8°, plotted as in D. (F) Mean gap-resolution thresholds at 4°, plotted in minutes of arc, following the conventions of D (although note the scale difference). (G) Mean gap-resolution thresholds at 8°. (H) Mean bisection thresholds at 4°, plotted in minutes of arc (note again the scale difference). (I) Mean bisection thresholds at 8°.

