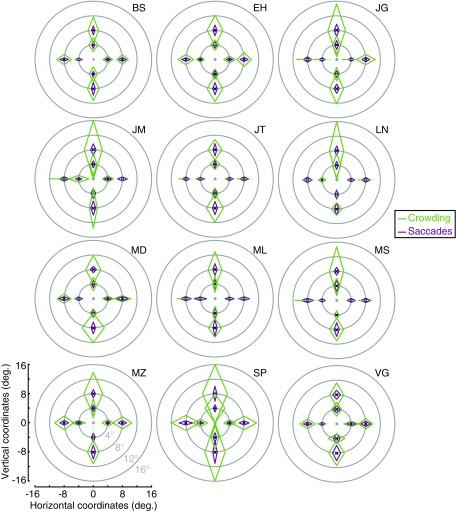
Fig. S1.
Individual data from experiment 1. Crowding (green) and saccade error (purple) zones for each participant, shown across the visual field. The fovea is shown as a gray dot with each zone plotted around the location of the central target during trials (black crosses). For each of the eight locations tested across the visual field, the size of the crowding and saccade error zones is shown for radial and tangential dimensions. Axes are shown in the Lower Left panel.

