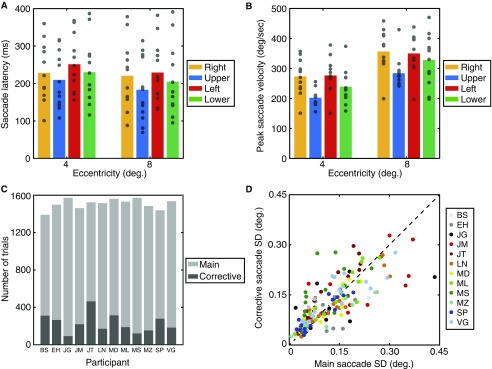
Fig. S2.
Saccade metrics from experiment 1. (A) Saccade latency values for each of the eight visual-field locations tested. Latencies are plotted by eccentricity on the x axis with the colored bars separating values for the four directions in the visual field (see legend). Mean values are shown as bars with individuals as gray points. (B) Peak saccade velocities for each of the eight visual-field locations, plotted as in A. (C) Frequency of corrective saccades on trials with an accurate main saccade. For each participant (indicated on the x axis), the number of trials with accurately recorded main saccades is shown as a light-gray bar and the number of these trials containing additional corrective saccades shown as a dark-gray bar. (D) Saccade precision for main saccades vs. corrective saccades. The SD of landing error values is plotted for main saccades on the x axis against corrective saccades on the y axis, both in degrees of visual angle. Individuals are color-coded (see legend) with unity values shown as a black dashed line.

